Status
View and manage Data Pipeline runs for your Project.
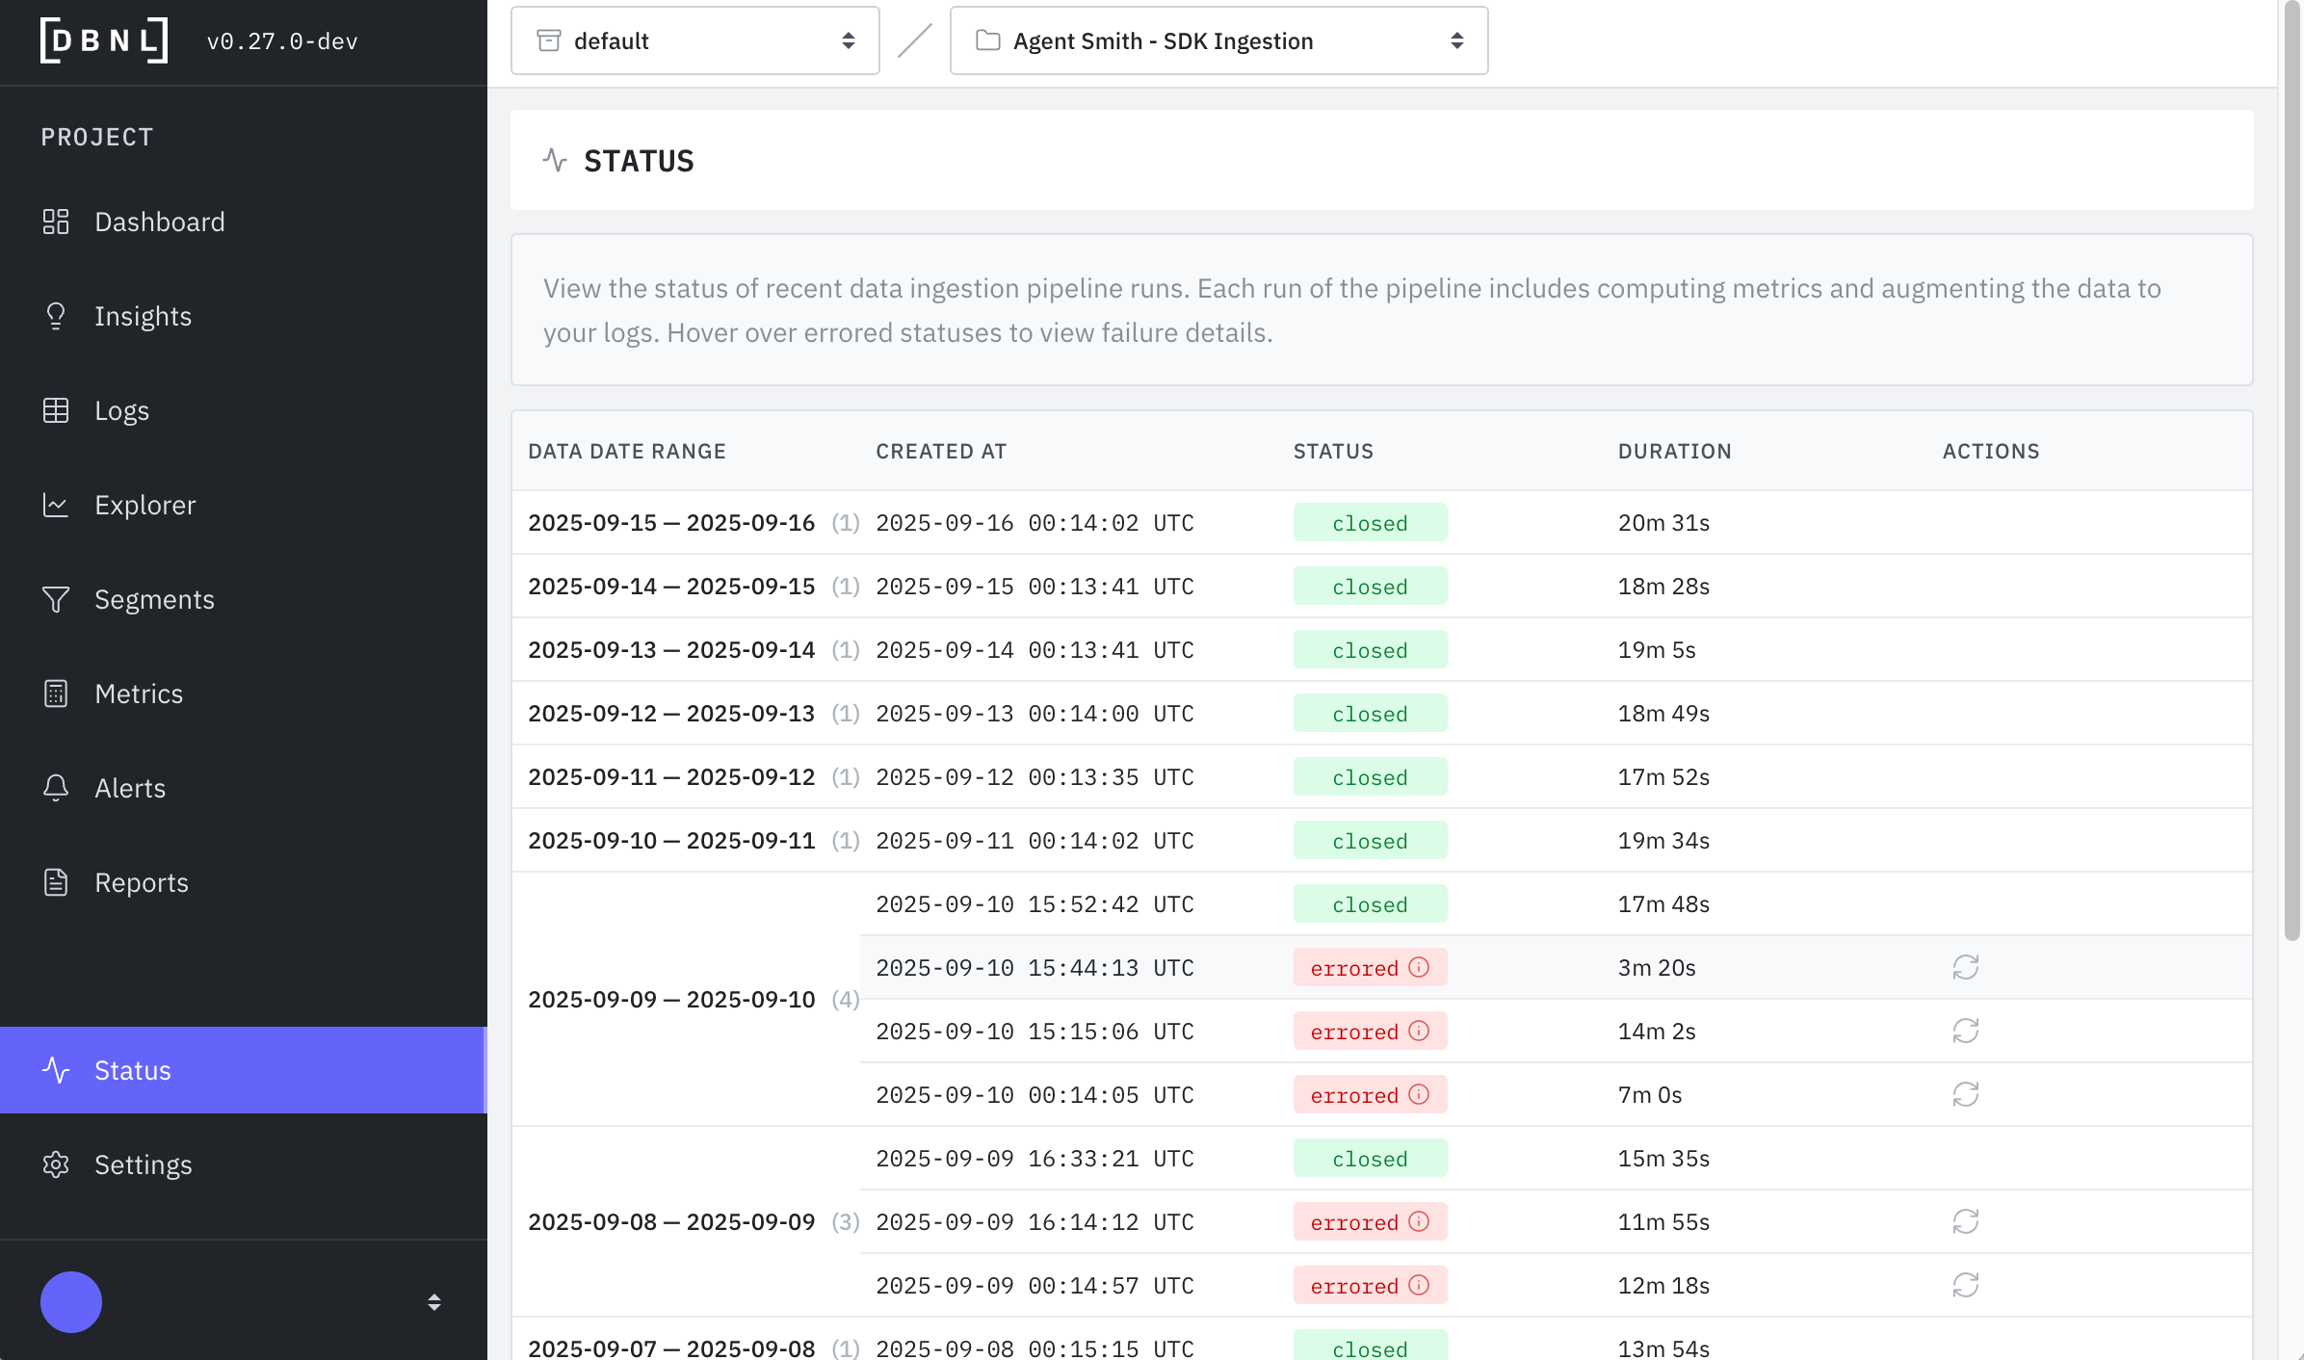
The Status page shows you all ongoing and previous DBNL Data Pipeline runs for your project.
These runs represent the entire Data Pipeline, including:
Data ingestion from the specified Data Connection for the Project
Log enrichment by appending Metrics using the Model Connection
Analysis and publishing of Insights
You can view the current status of each run grouped by data date range, which time window DBNL was ingesting data for. If a Data Pipeline run has errored you can hover over the error status to view the exception and restart the run by clicking on the restart button in the actions column.
Expected Pipeline Duration
Typical pipeline run times depend on log volume and Model Connection latency:
< 1,000 logs
3-7 minutes
Fast for testing/POC
1,000-10,000 logs
10-30 minutes
Typical small projects
10,000-100,000 logs
30-90 minutes
Standard production workload
> 100,000 logs
1-3 hours
Large-scale deployments
Pipeline stages and their typical durations:
Ingest (10-30 seconds): Upload and validate data
Enrich (60-80% of total time): Compute metrics using Model Connection
Analyze (10-20% of total time): Run unsupervised learning algorithms
Publish (30-60 seconds): Update dashboards and generate insights
Enrich is the slowest stage because it calls your Model Connection for each log. Faster Model Connections (local NVIDIA NIMs) will significantly reduce total pipeline time compared to external APIs.
The DBNL Data Pipeline contains many different tasks and can be complex to debug. Please reach out to us at [email protected] or distributional.com/contact and we would be happy to help.

Was this helpful?

