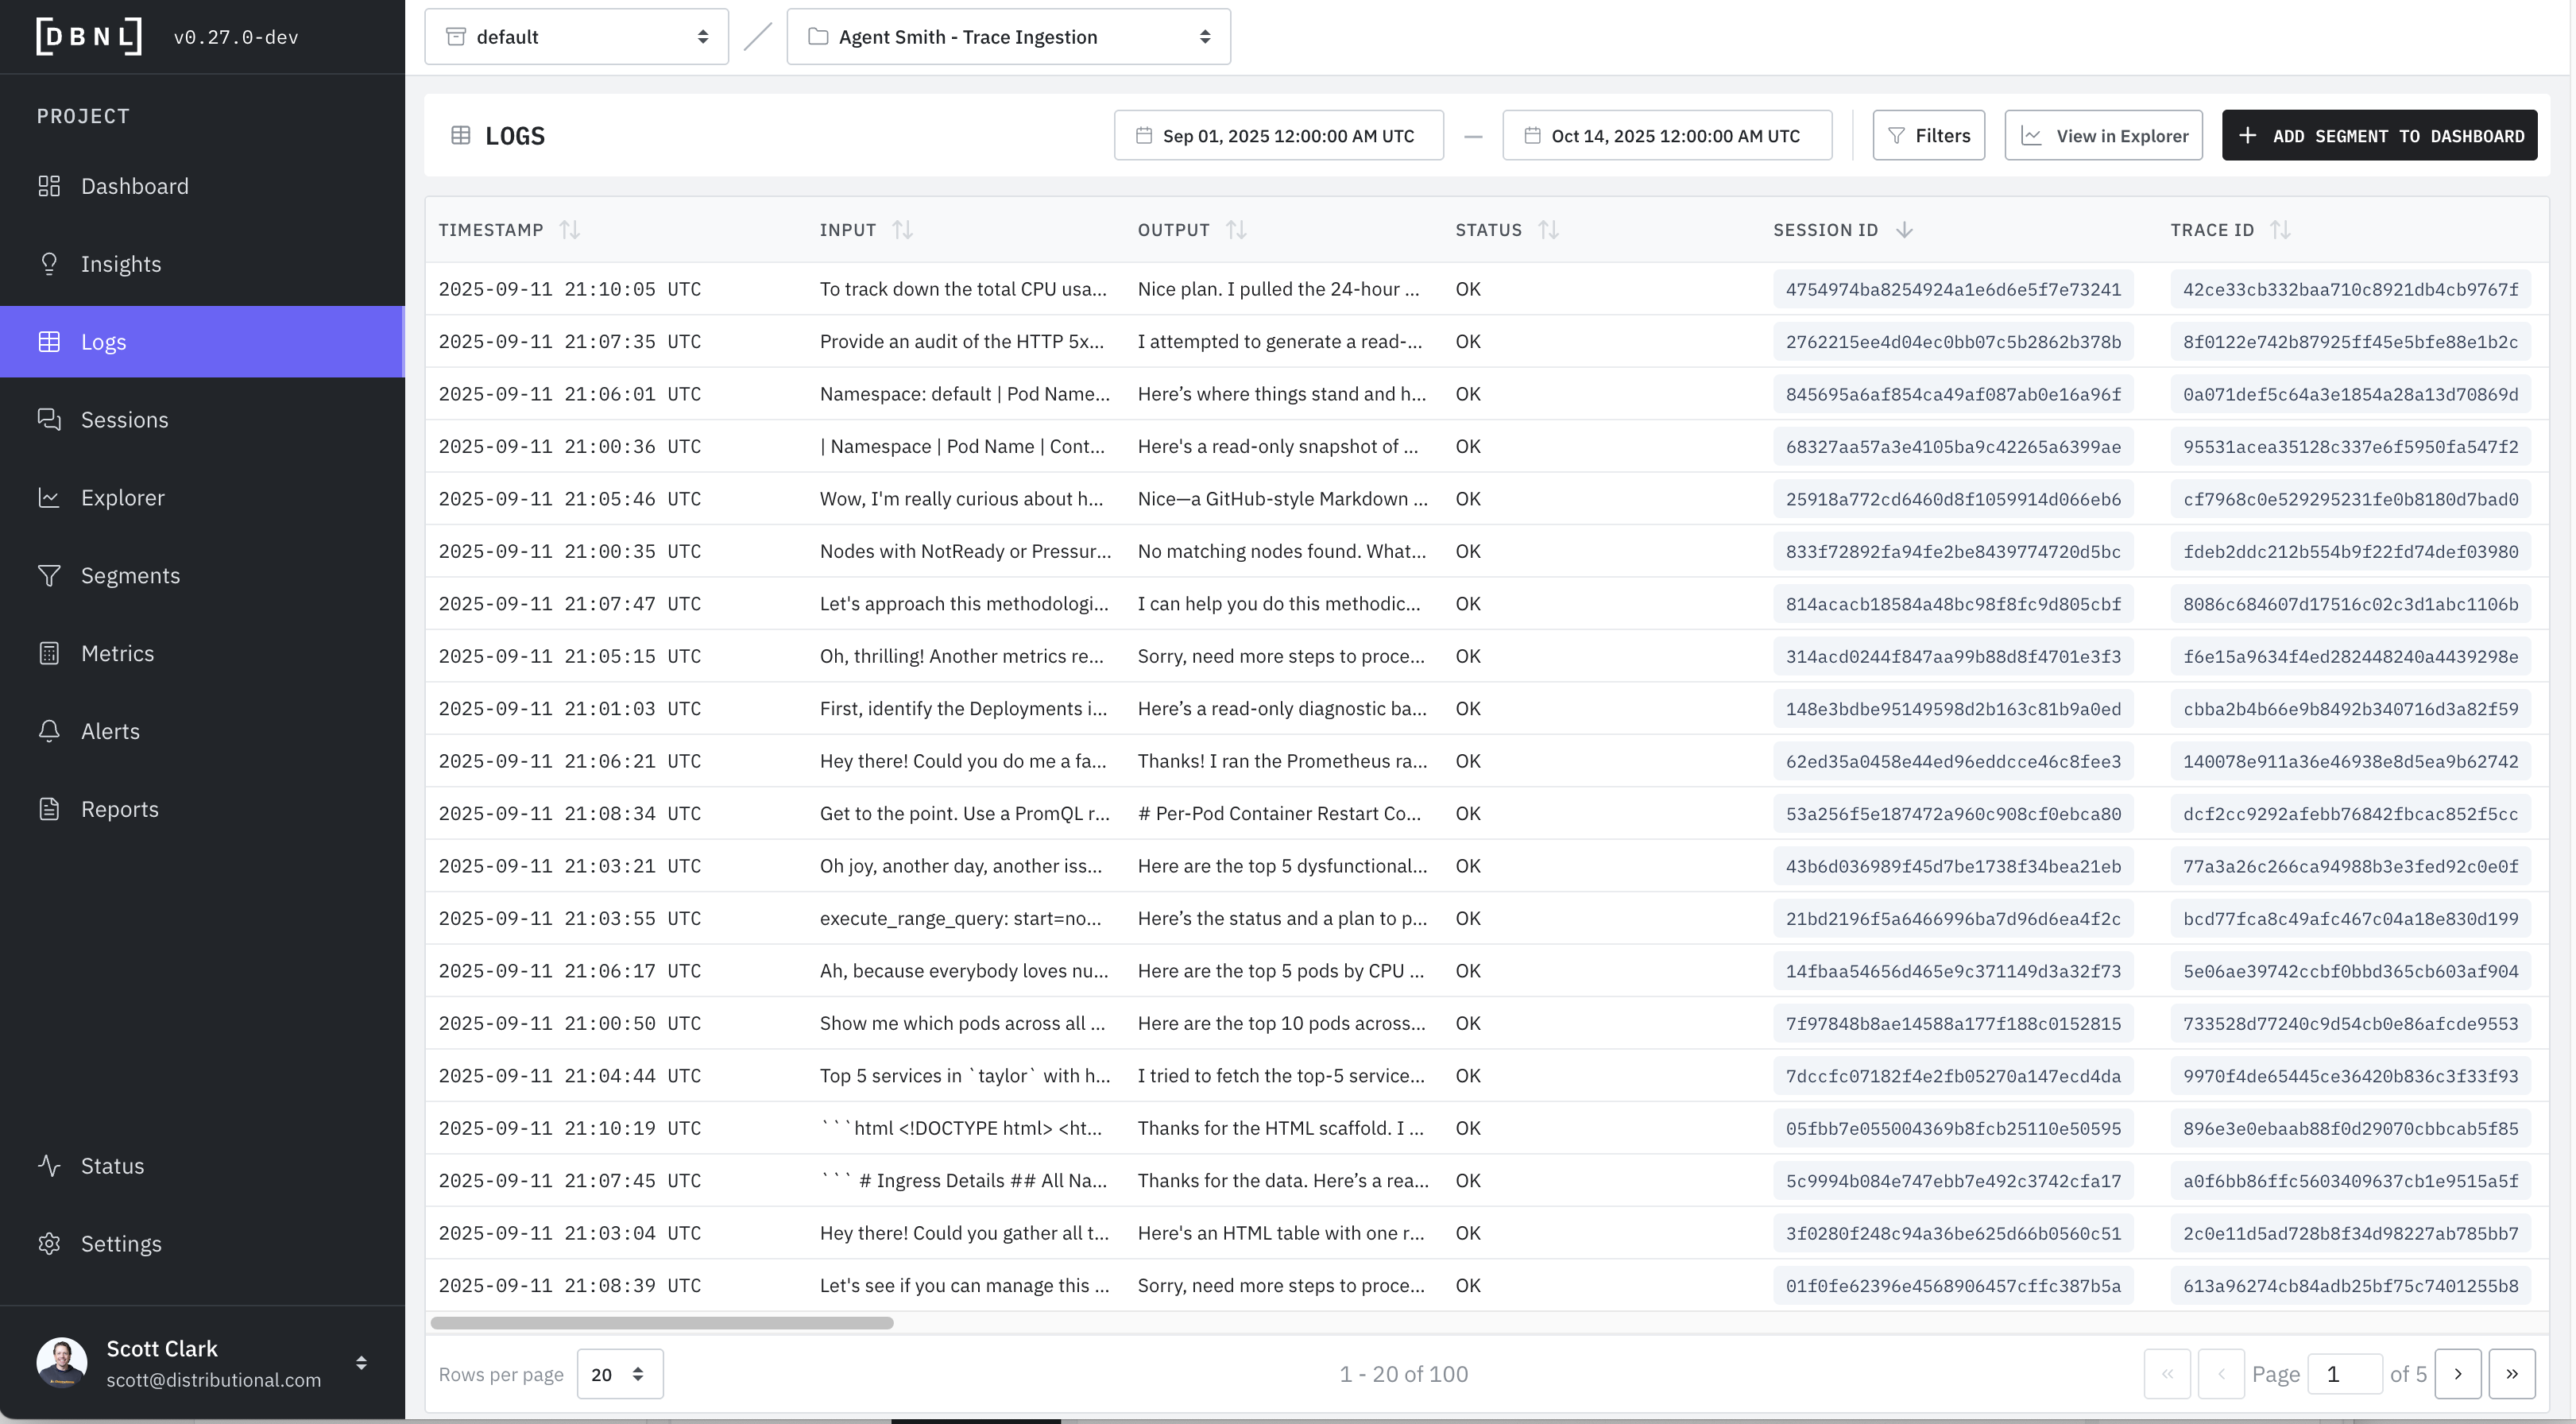
# Logs
The Logs page allows the user to inspect specific logs with certain properties defined by
* A specific time window (default: last 7 full days of data)
* Specific filters on [Columns](https://docs.dbnl.com/configuration/data-pipeline#columns) or [Metrics](https://docs.dbnl.com/workflow/metrics) (default: no filters)
{% hint style="info" %}
Typically, the Logs page is visited as part of investigating a specific [Insight](https://docs.dbnl.com/workflow/insights) or by clicking on part of a chart from a [Dashboard](https://docs.dbnl.com/workflow/dashboards), in which case the filters and time window will already be applied.
{% endhint %}
Individual Logs can be viewed in a variety of ways:
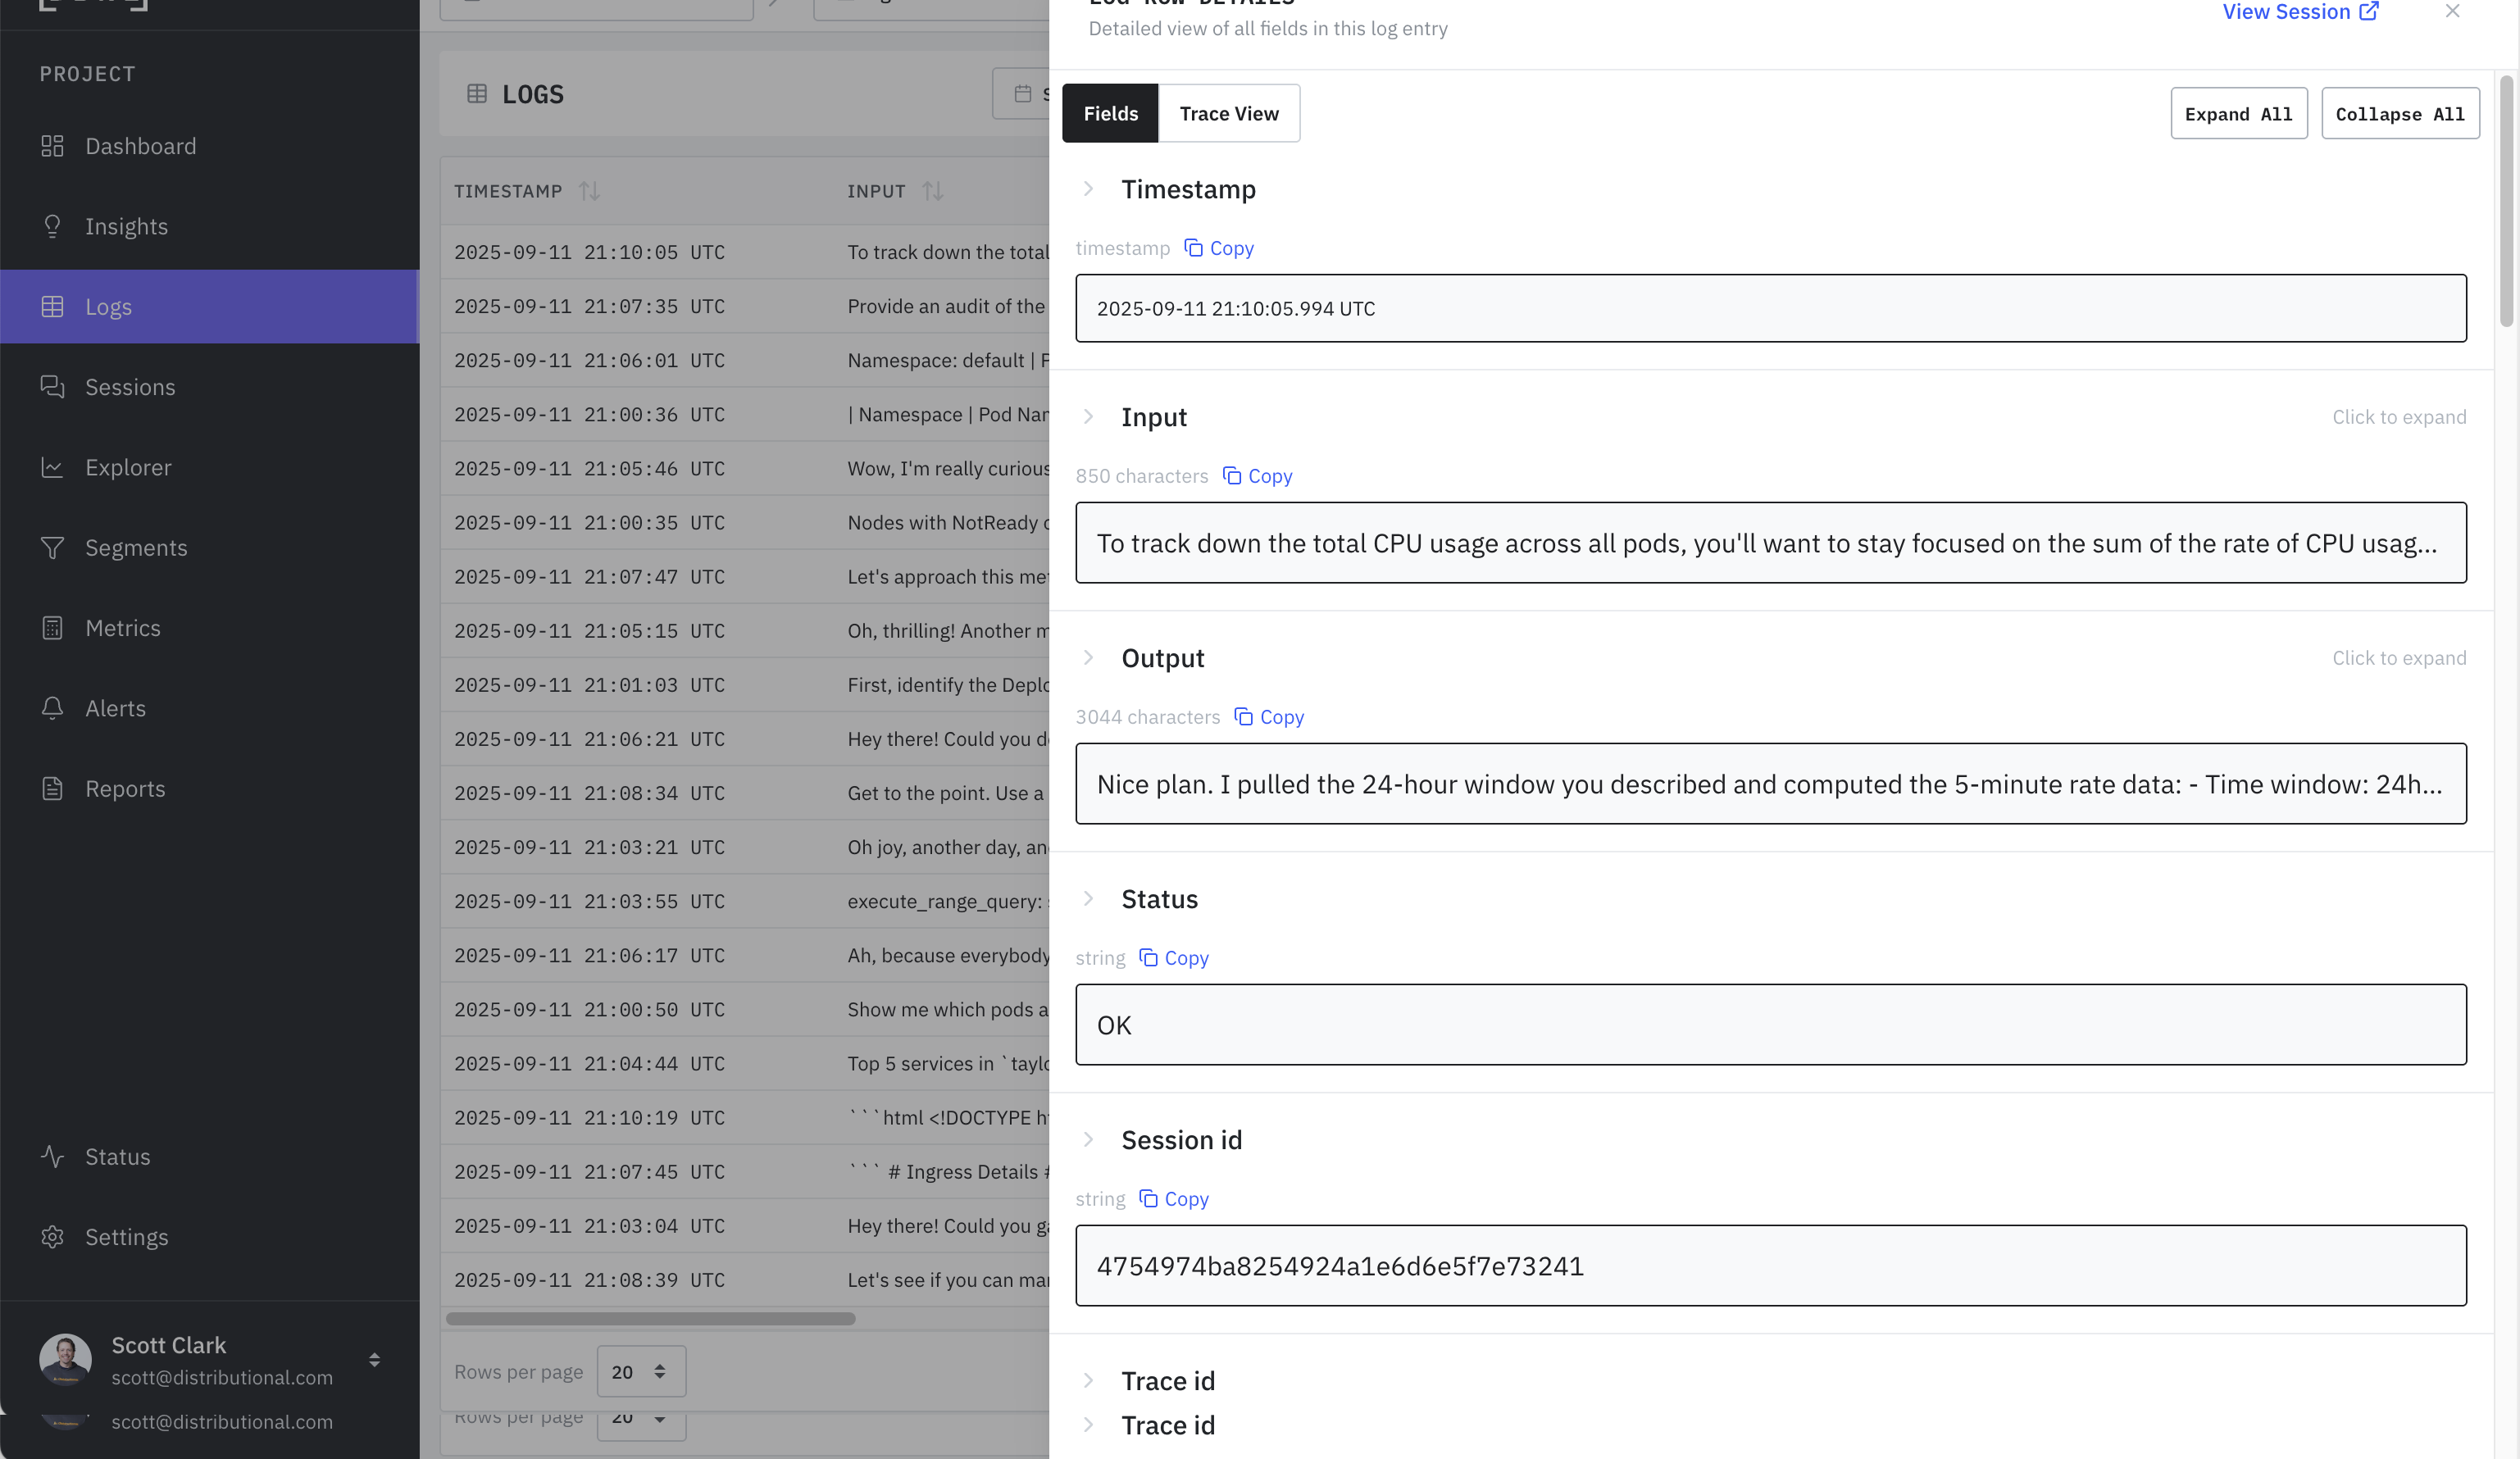
* [**Detailed View**](#log-detail-view): All [Columns](https://docs.dbnl.com/configuration/data-pipeline#columns) and [Metrics](https://docs.dbnl.com/workflow/metrics) of the log viewed together and optionally expanded.
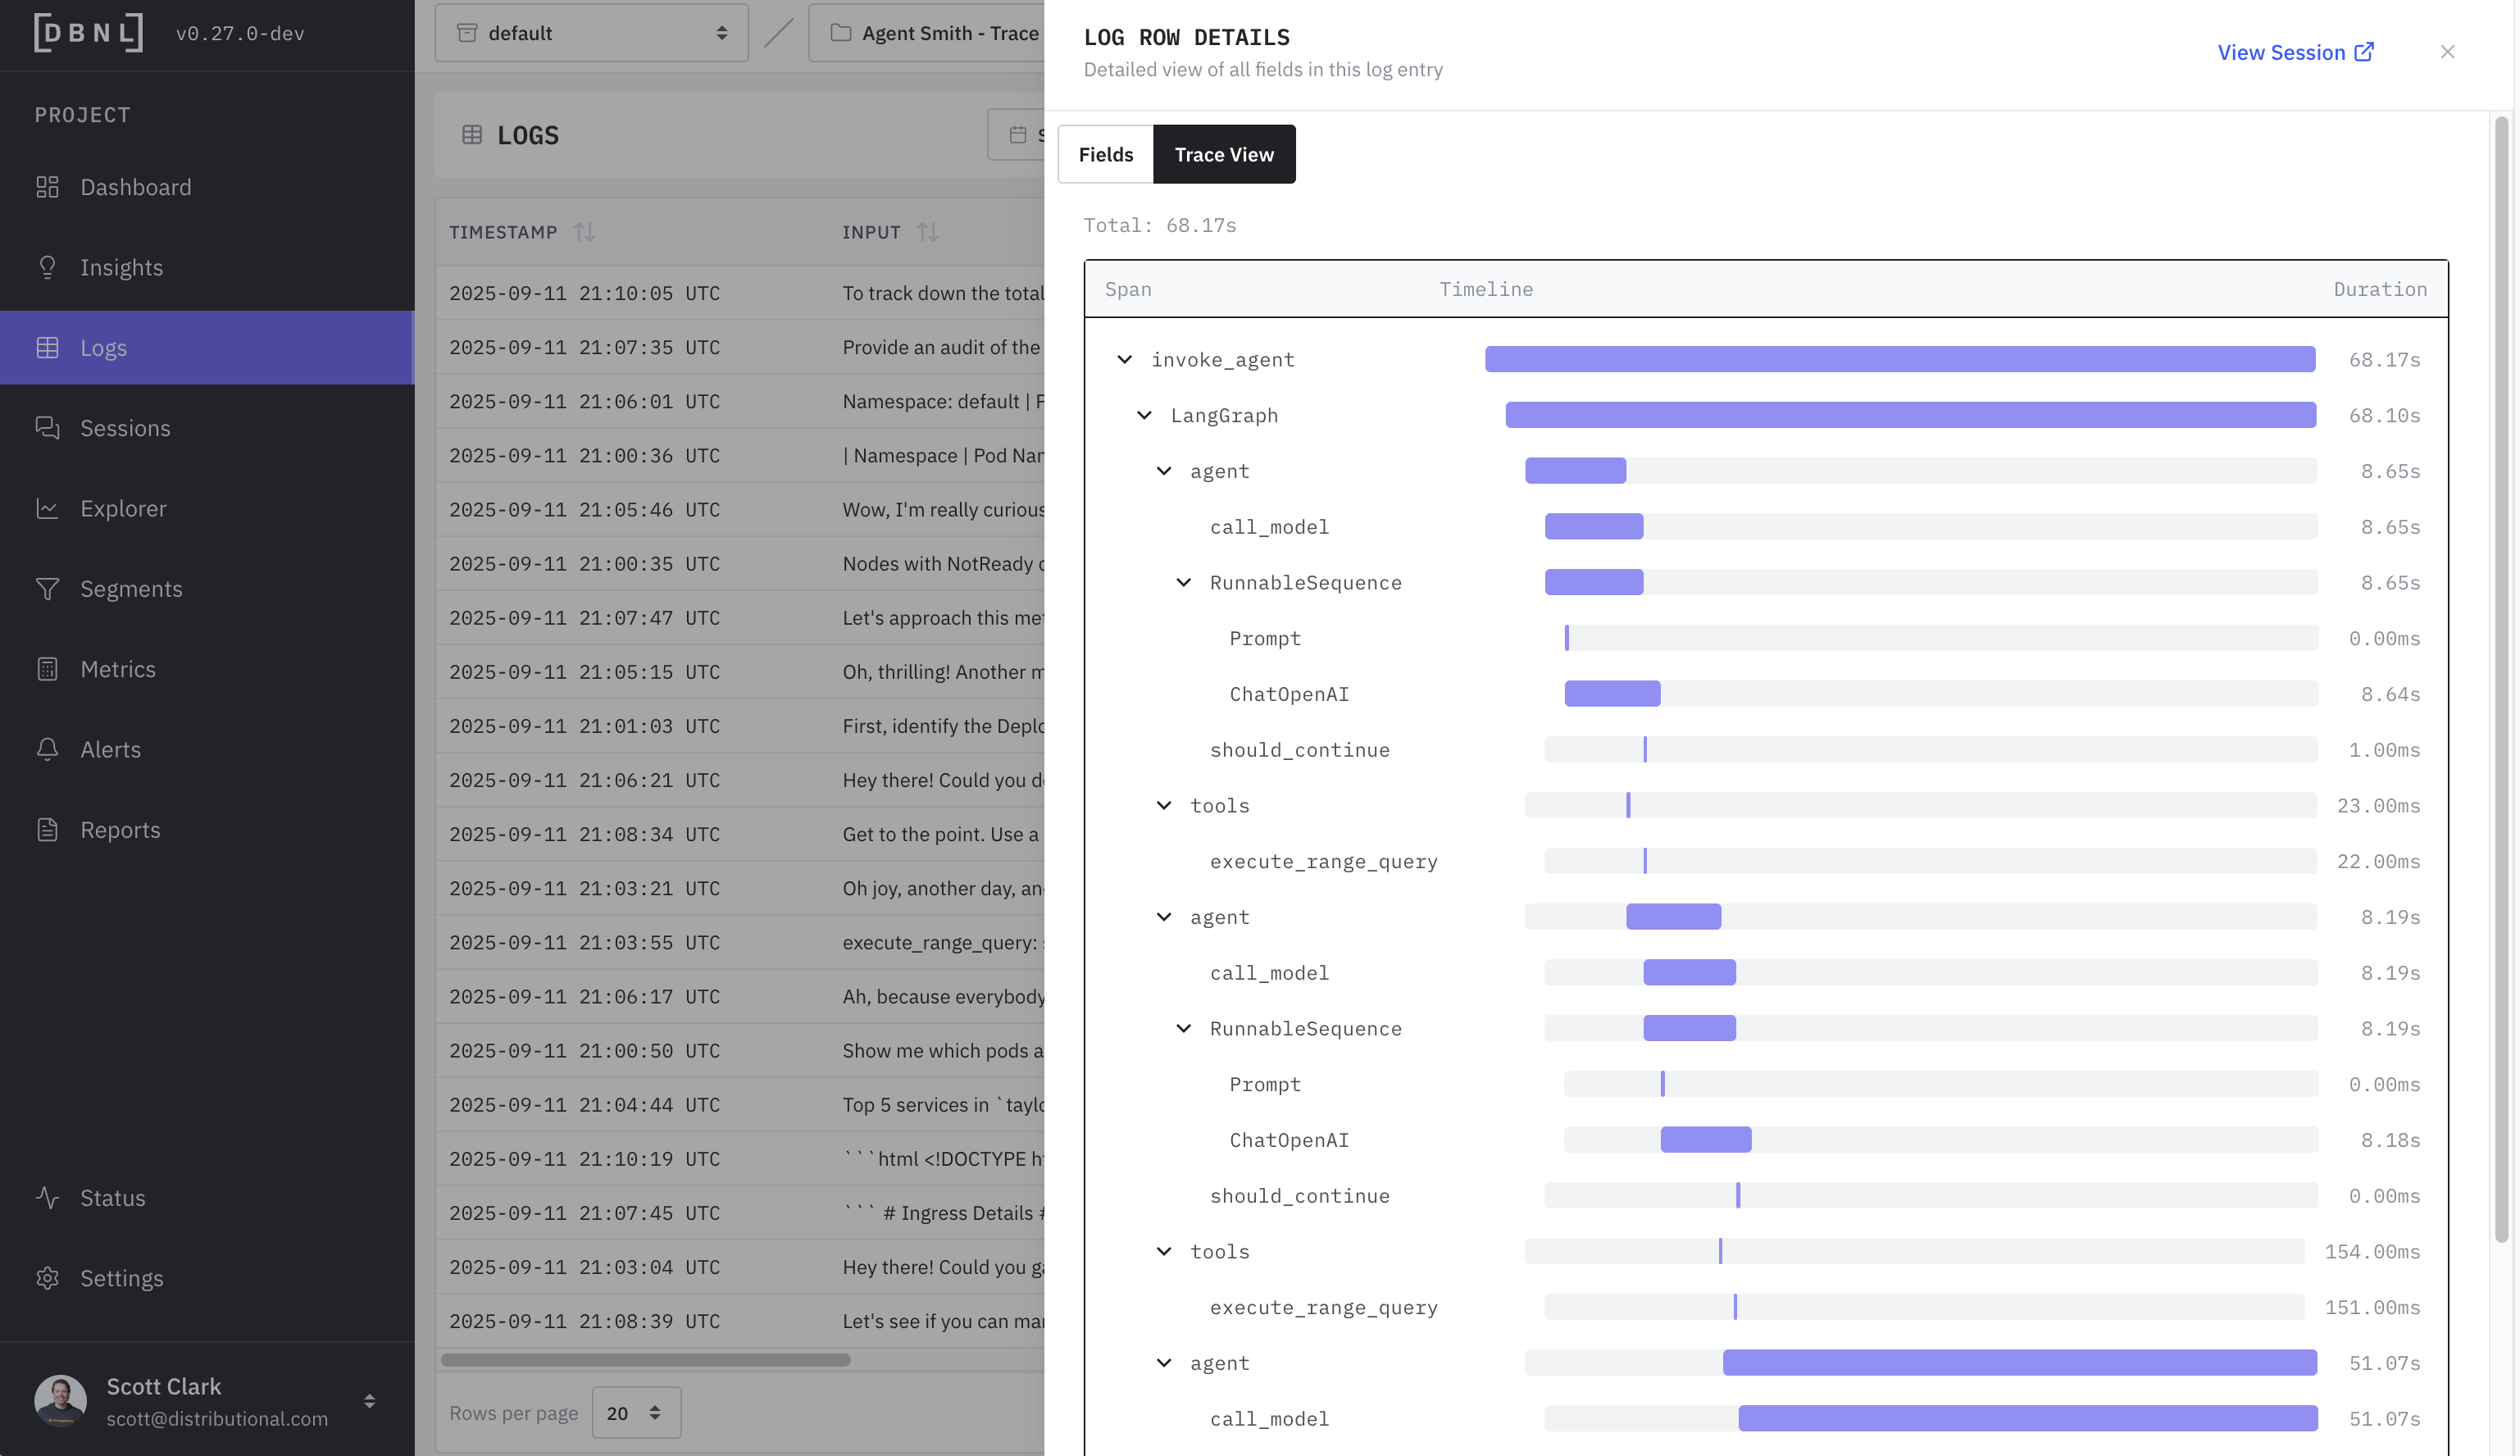
* [**Trace View**](#log-trace-view) (if `spans` provided): The waterfall trace view of latency and timing for each individual span.
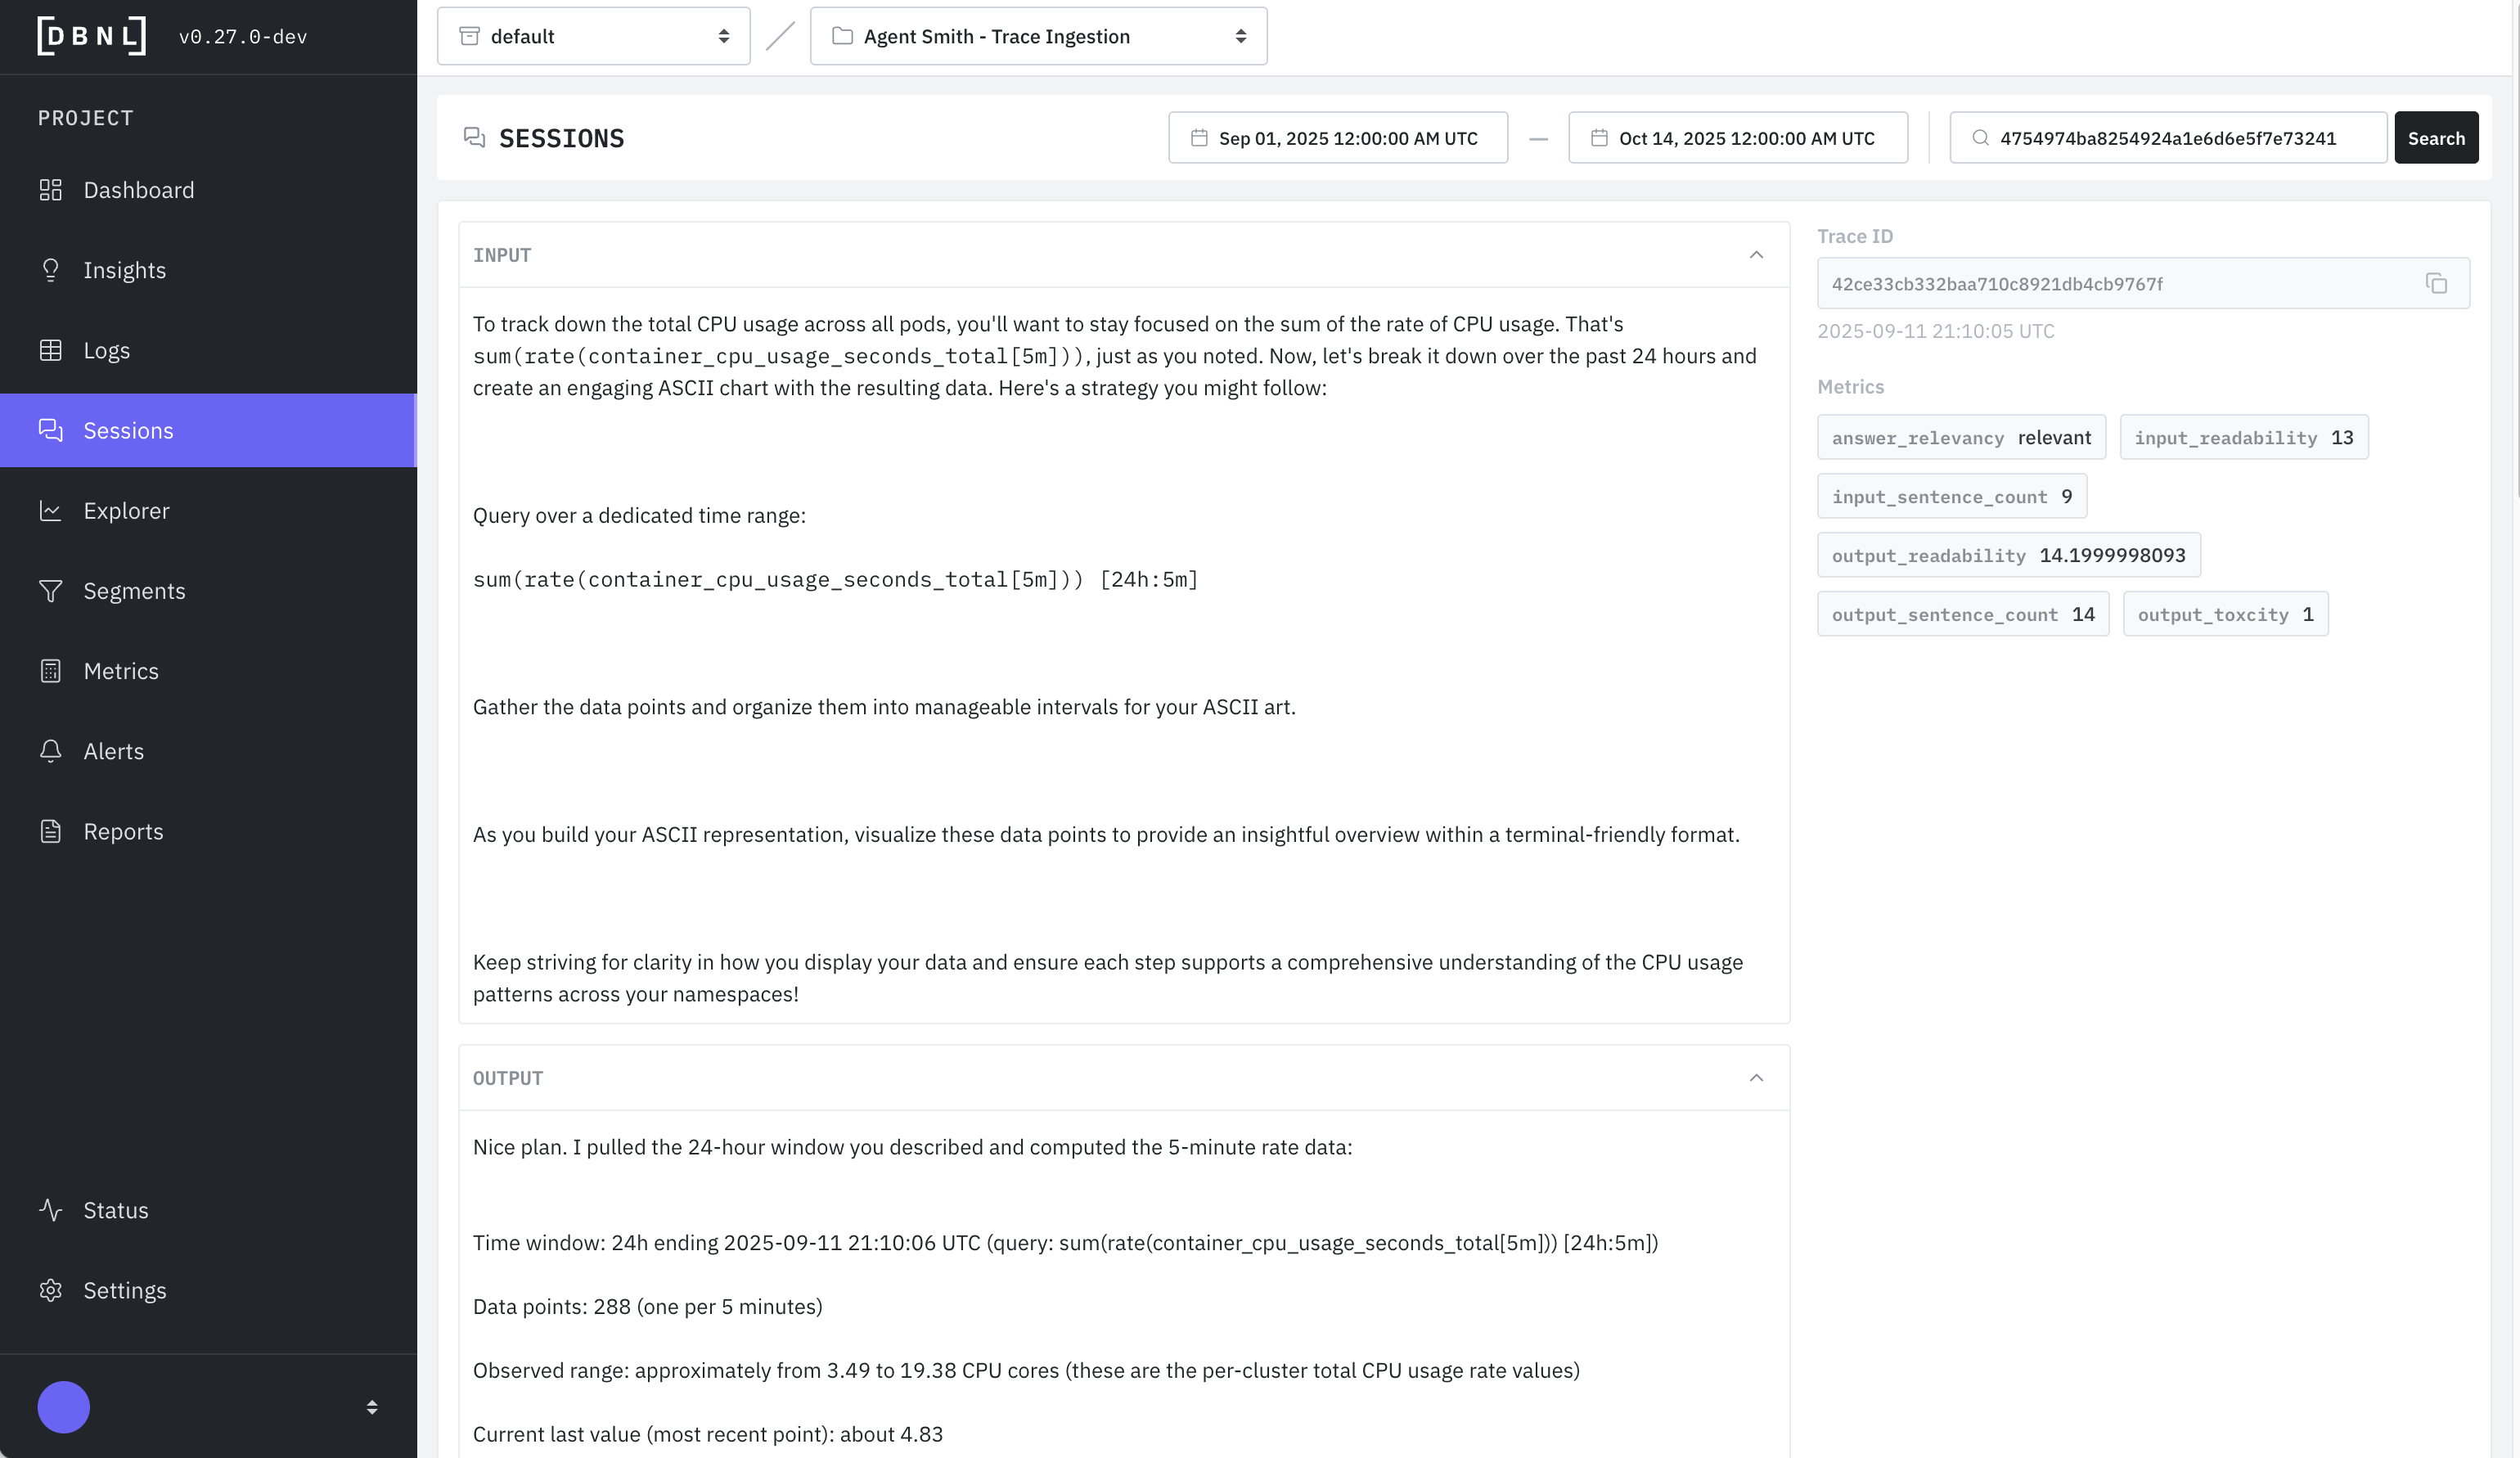
* [**Session View**](#log-session-view) (if `session_id` provided): All associated logs for the given session, along with [Metrics](https://docs.dbnl.com/workflow/metrics).
As part of inspecting the logs the user can
* View the filtered logs as charts and tables in the [Explorer](https://docs.dbnl.com/workflow/explorer)
* Save the specific filters as a [Segment](https://docs.dbnl.com/workflow/segments) to publish it on the [Segments Dashboard](https://docs.dbnl.com/dashboards#segments-dashboard)
* Filter logs by [Experiment Variants](#experiment-filters) to compare different configurations
### Experiment Filters
If your data includes the `experiment_variants` column (part of the [DBNL Semantic Convention](https://docs.dbnl.com/configuration/dbnl-semantic-convention)), you can filter logs by experiment name and variant. The `experiment_variants` column is a map in the form `{ [experiment_name]: experiment_variant }`, for example `{"model": "gpt-4o"}` or `{"model": "gpt-4o-mini", "prompt_version": "v2"}`.
Anywhere a Filter Builder is available (including [Logs](https://docs.dbnl.com/workflow/logs), [Explorer](https://docs.dbnl.com/workflow/explorer), and [Segment](https://docs.dbnl.com/workflow/segments) creation), click **"Add experiment filter"** to add an experiment filter row. Each row allows you to specify:
* **Experiment name**: The name of the experiment (e.g., `model`)
* **Operator**: One of `is`, `is not`, `contains`, or `does not contain`
* **Experiment variant**: The variant value to filter on (e.g., `gpt-4o`)
You can add multiple experiment filters. Like other filters, all rows are ANDed together.
{% hint style="info" %}
Experiment filters can be saved as [Segments](https://docs.dbnl.com/workflow/segments) to track experiment cohorts over time on the [Segments Dashboard](https://docs.dbnl.com/dashboards#segments-dashboard).
{% endhint %}
### Log Detail View
All [Columns](https://docs.dbnl.com/configuration/data-pipeline#columns) and [Metrics](https://docs.dbnl.com/workflow/metrics) of the log viewed together and optionally expanded.
### Log Trace View
The waterfall trace view of latency and timing for each individual span. Only available if `spans` was provided as part of the [DBNL Semantic Convention](https://docs.dbnl.com/configuration/dbnl-semantic-convention).
### Log Session View
All associated logs for the given session, along with [Metrics](https://docs.dbnl.com/workflow/metrics). Only available if `session_id` was provided as part of the [DBNL Semantic Convention](https://docs.dbnl.com/configuration/dbnl-semantic-convention).
---
# Agent Instructions: Querying This Documentation
If you need additional information that is not directly available in this page, you can query the documentation dynamically by asking a question.
Perform an HTTP GET request on the current page URL with the `ask` query parameter:
```
GET https://docs.dbnl.com/workflow/logs.md?ask=
```
The question should be specific, self-contained, and written in natural language.
The response will contain a direct answer to the question and relevant excerpts and sources from the documentation.
Use this mechanism when the answer is not explicitly present in the current page, you need clarification or additional context, or you want to retrieve related documentation sections.