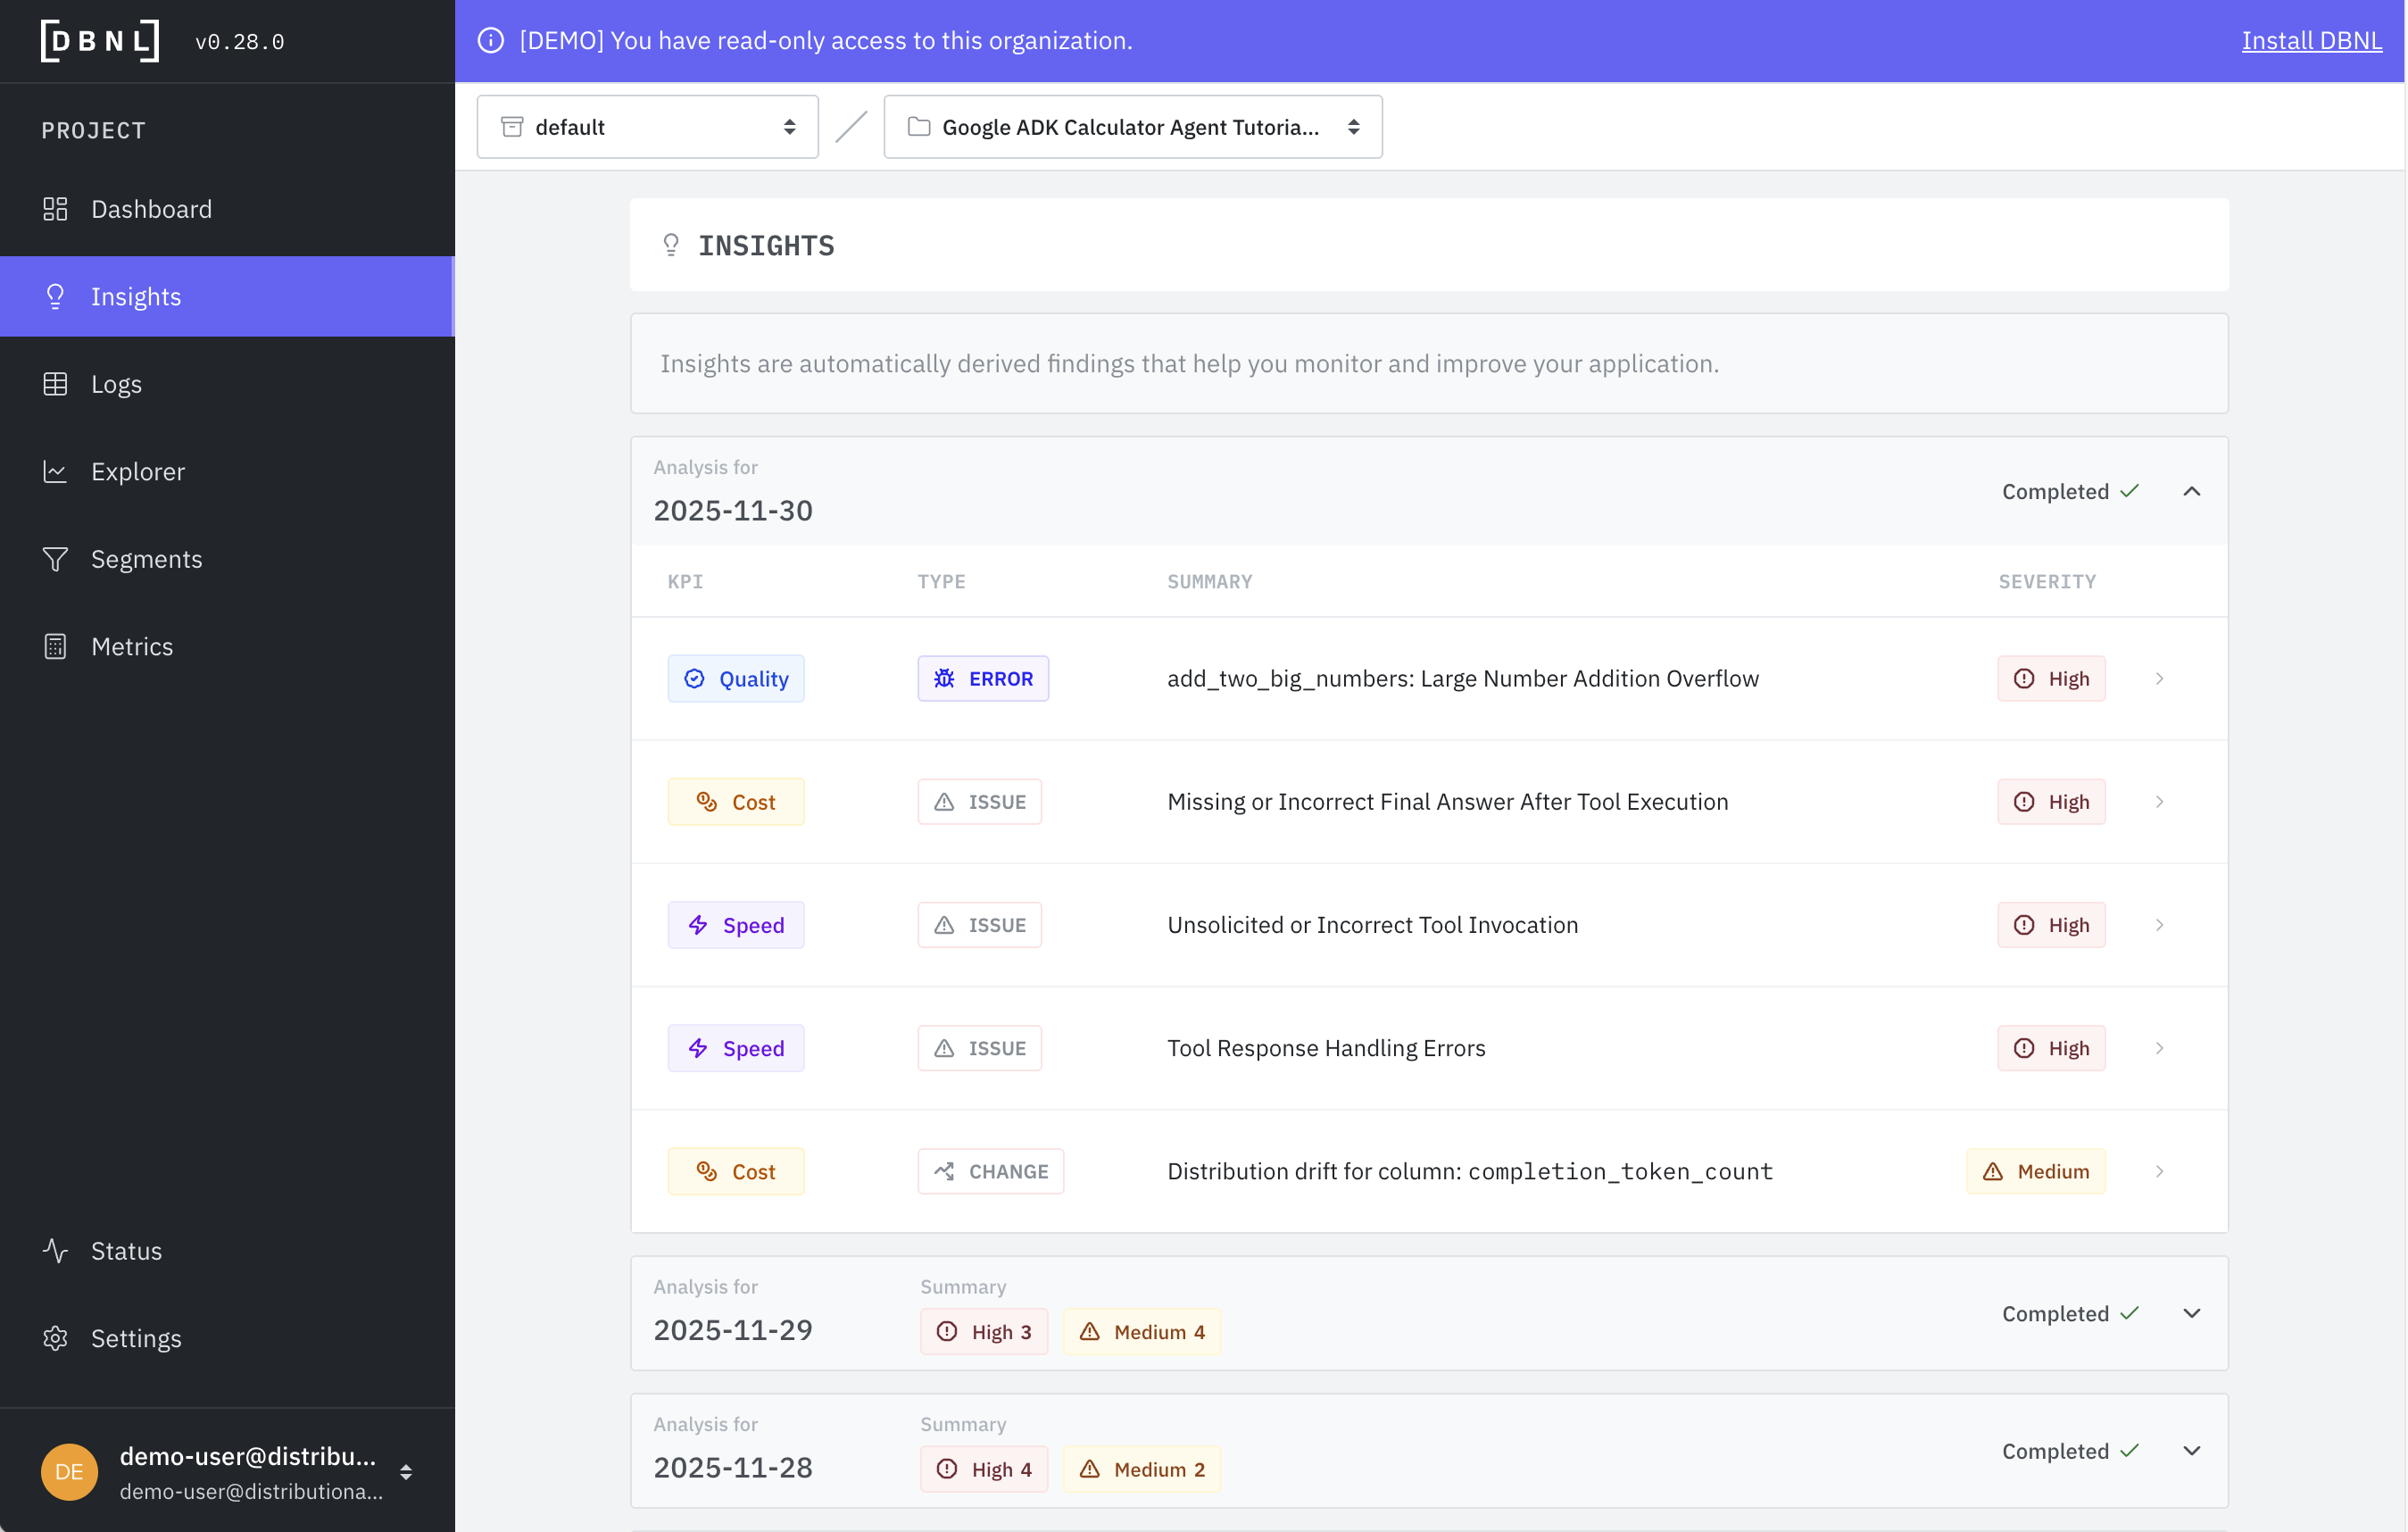
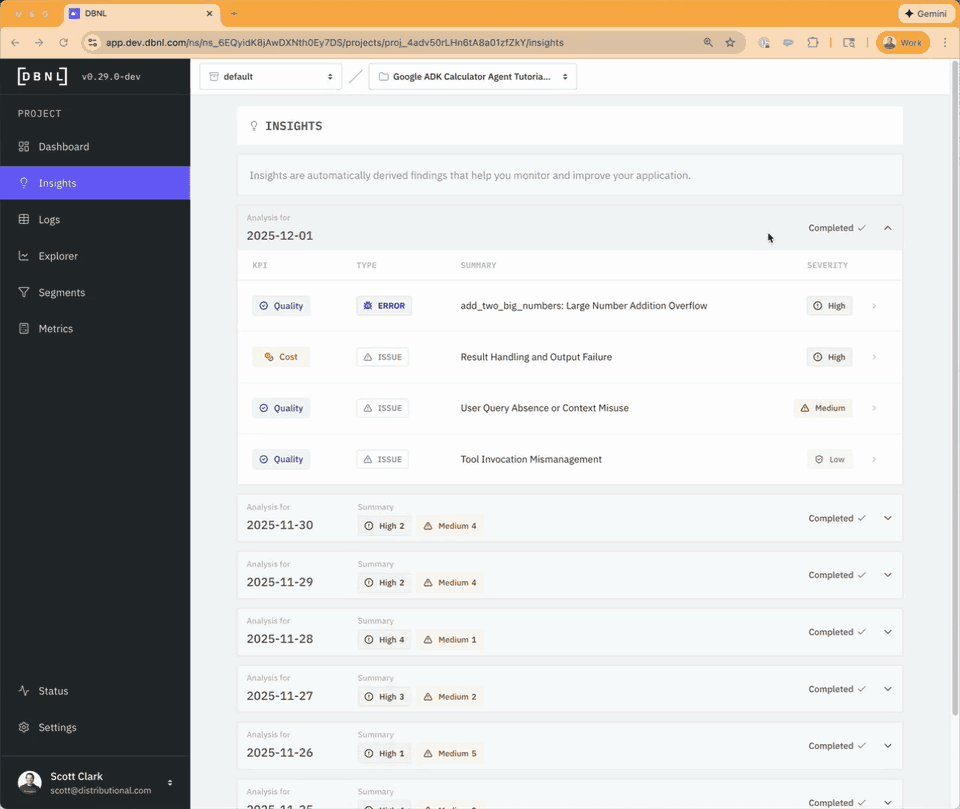
# Insights
An Insight is a detected behavioral signal generated from unsupervised analysis of enriched logs as part of the [Data Pipeline](https://docs.dbnl.com/configuration/data-pipeline).
Insights represent signals that the user can triage and refine through the [Explorer](https://docs.dbnl.com/workflow/explorer) or inspection of [Logs](https://docs.dbnl.com/workflow/logs) and track as [Metrics](https://docs.dbnl.com/workflow/metrics) or [Segments](https://docs.dbnl.com/workflow/segments). They represent clusters of log data defined by filters on Columns corresponding to unique patterns of behavior. Insights can point to errors, issues, or changes within your agentic application that can be used to inform where and how to improve or fix your agent as part of an [Analytics-Driven Data Flywheel](https://docs.dbnl.com/get-started/readme#analytics-driven-ai-data-flywheel). Insights can reveal new metrics to eval or incorporate into reward functions, they can also pinpoint specific segments of data that can be used for focued post-training optimization, whether that be fine tuning, reinforcement learning, [hyperparameter optimization](https://docs.dbnl.com/examples/tutorials#hyperparameter-optimization-tutorial), [prompt optimization](https://docs.dbnl.com/examples/walkthroughs#outing-agent-prompt-optimization-walkthrough), or any other method.
### What to Expect
**Typical insight volume:** Most projects generate 5-20 new insights per week. Projects with stable, consistent behavior may generate fewer insights, while projects with volatile or rapidly changing behavior may generate more.
**Insight Structure**
* **Summary**: Human readable explaination of Insight with impact and severity
* **Examples**: Specific evidence of the discovered pattern from the logs
* **Potential Fixes**: How you could remediate the issue, ranked by effort. Used to complete the Analytics-Driven Data Flywheel by helping you fix or improve your agent.
* **Suggested Segment**: A filter on the logs that approximates the behavior observed by the Insight. Used for tracking the issue and that it is corrected by the chosen fix.
{% hint style="info" %}
**Suggested Workflow**: Copy and paste a Potential Fix directly into a coding agent like Claude or Codex. Often the suggested fix and example log lines are enough to get a fix in place.
{% endhint %}
**If you see no insights:**
* DBNL requires at least 7 days of data to establish behavioral baselines
* Check the [Status page](https://docs.dbnl.com/workflow/status) to ensure pipeline runs are completing successfully
* Verify sufficient log volume (insights are more meaningful with hundreds of logs per day)
* Very stable systems with little variation may naturally generate fewer insights
---
# Agent Instructions: Querying This Documentation
If you need additional information that is not directly available in this page, you can query the documentation dynamically by asking a question.
Perform an HTTP GET request on the current page URL with the `ask` query parameter:
```
GET https://docs.dbnl.com/workflow/insights.md?ask=
```
The question should be specific, self-contained, and written in natural language.
The response will contain a direct answer to the question and relevant excerpts and sources from the documentation.
Use this mechanism when the answer is not explicitly present in the current page, you need clarification or additional context, or you want to retrieve related documentation sections.