# Data Pipeline
The Data Pipeline is how DBNL converts raw production AI log data into actionable [Insights](https://docs.dbnl.com/workflow/insights) and [Dashboards](https://docs.dbnl.com/workflow/dashboards) for each [Project](https://docs.dbnl.com/workflow/projects) and stores it for future analysis within the [Data Model](#data-model).
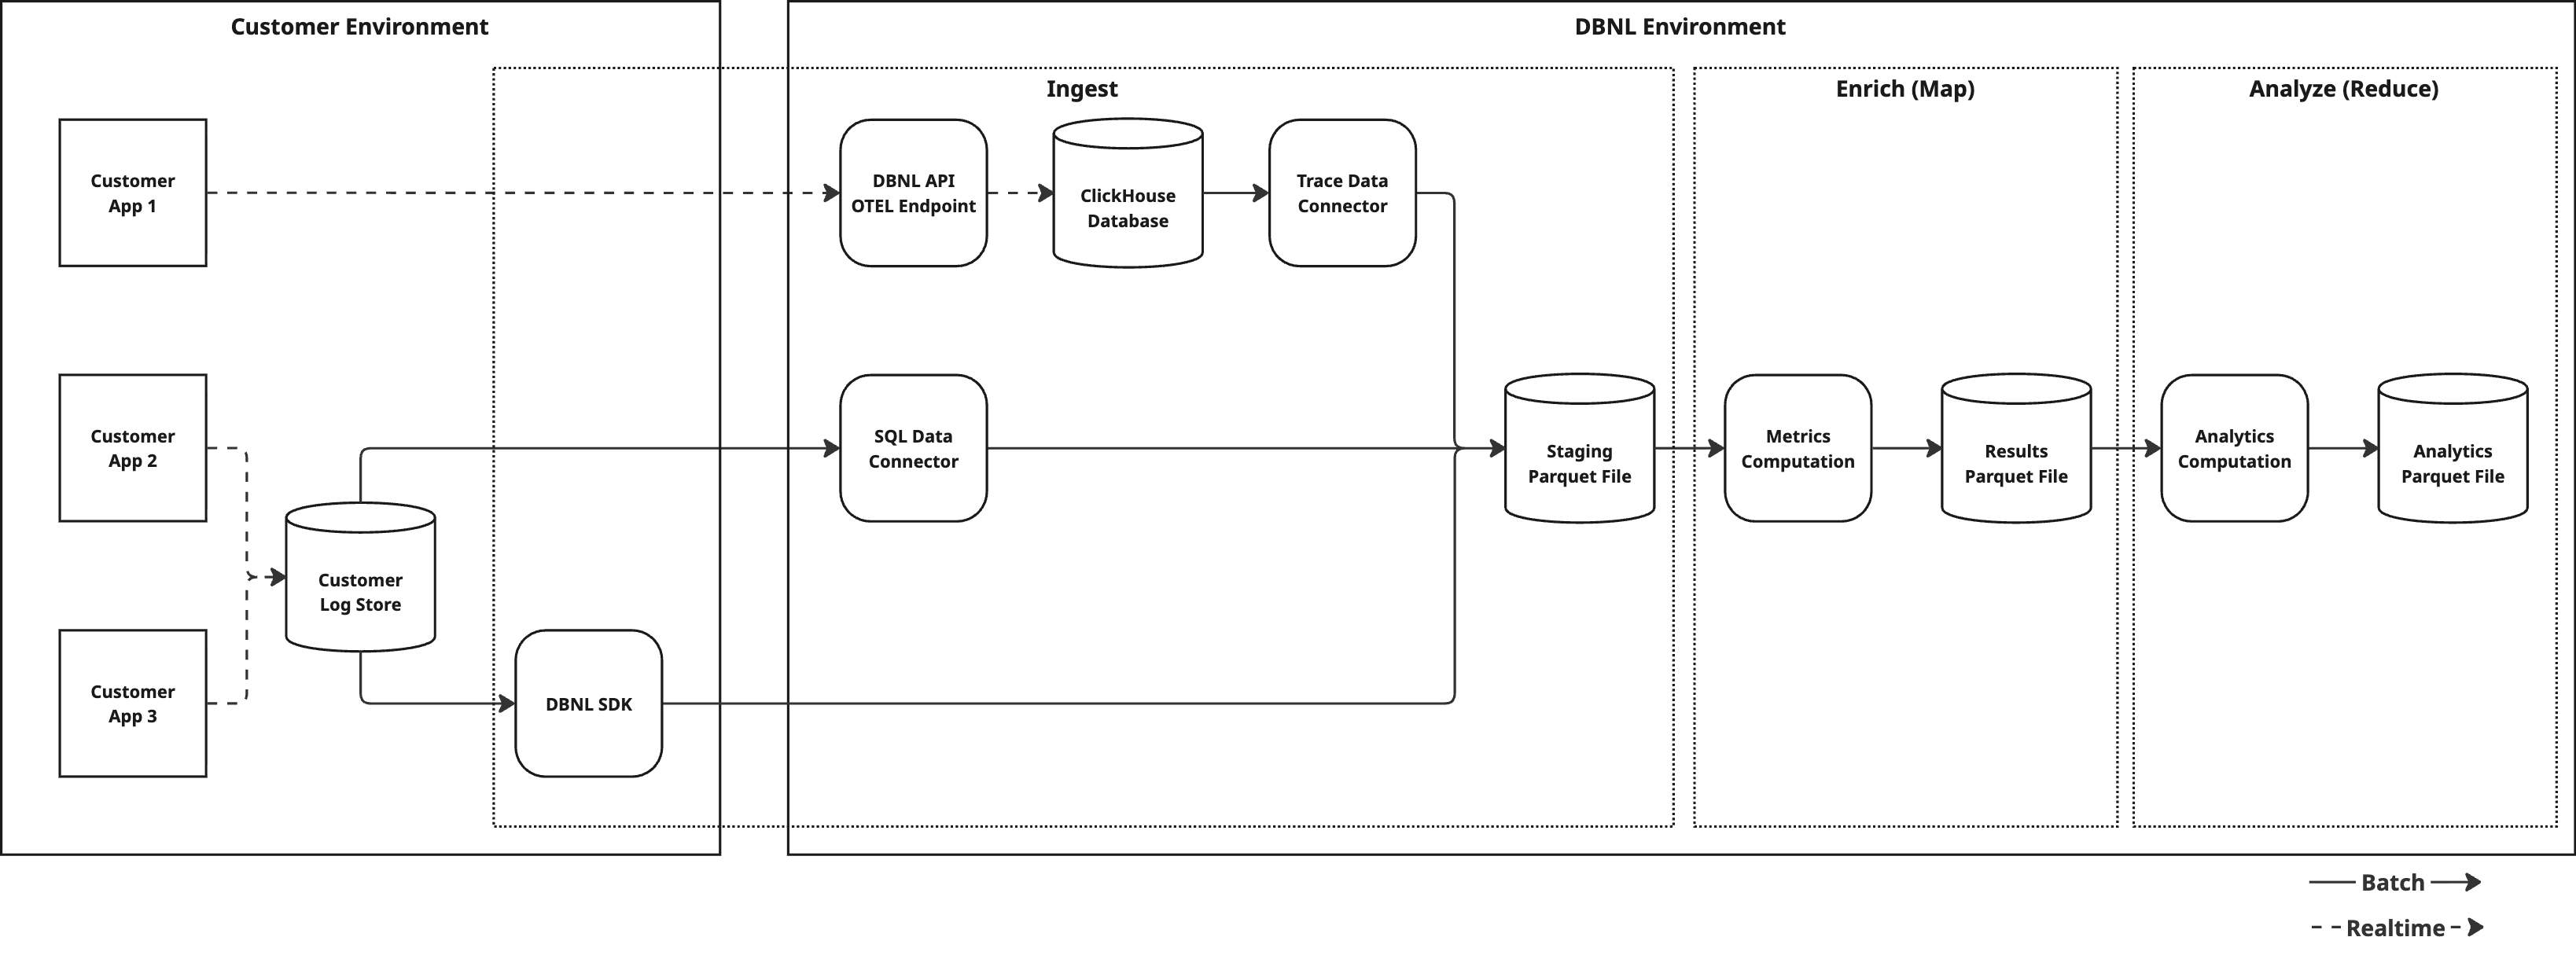
The Data Pipeline is invoked as production log data is ingested into your DBNL [Deployment](https://docs.dbnl.com/platform/deployment). This process kicks off at data ingestion if using [SDK Log Ingestion](https://docs.dbnl.com/configuration/data-connections/sdk-log-ingestion) and daily at UTC midnight for [OTEL Trace Ingestion](https://docs.dbnl.com/configuration/data-connections/otel-trace-ingestion).
{% hint style="info" %}
You can inspect the status of Data Pipeline Runs and restart them from the [Status](https://docs.dbnl.com/workflow/status) page of a [Project](https://docs.dbnl.com/workflow/projects).
{% endhint %}
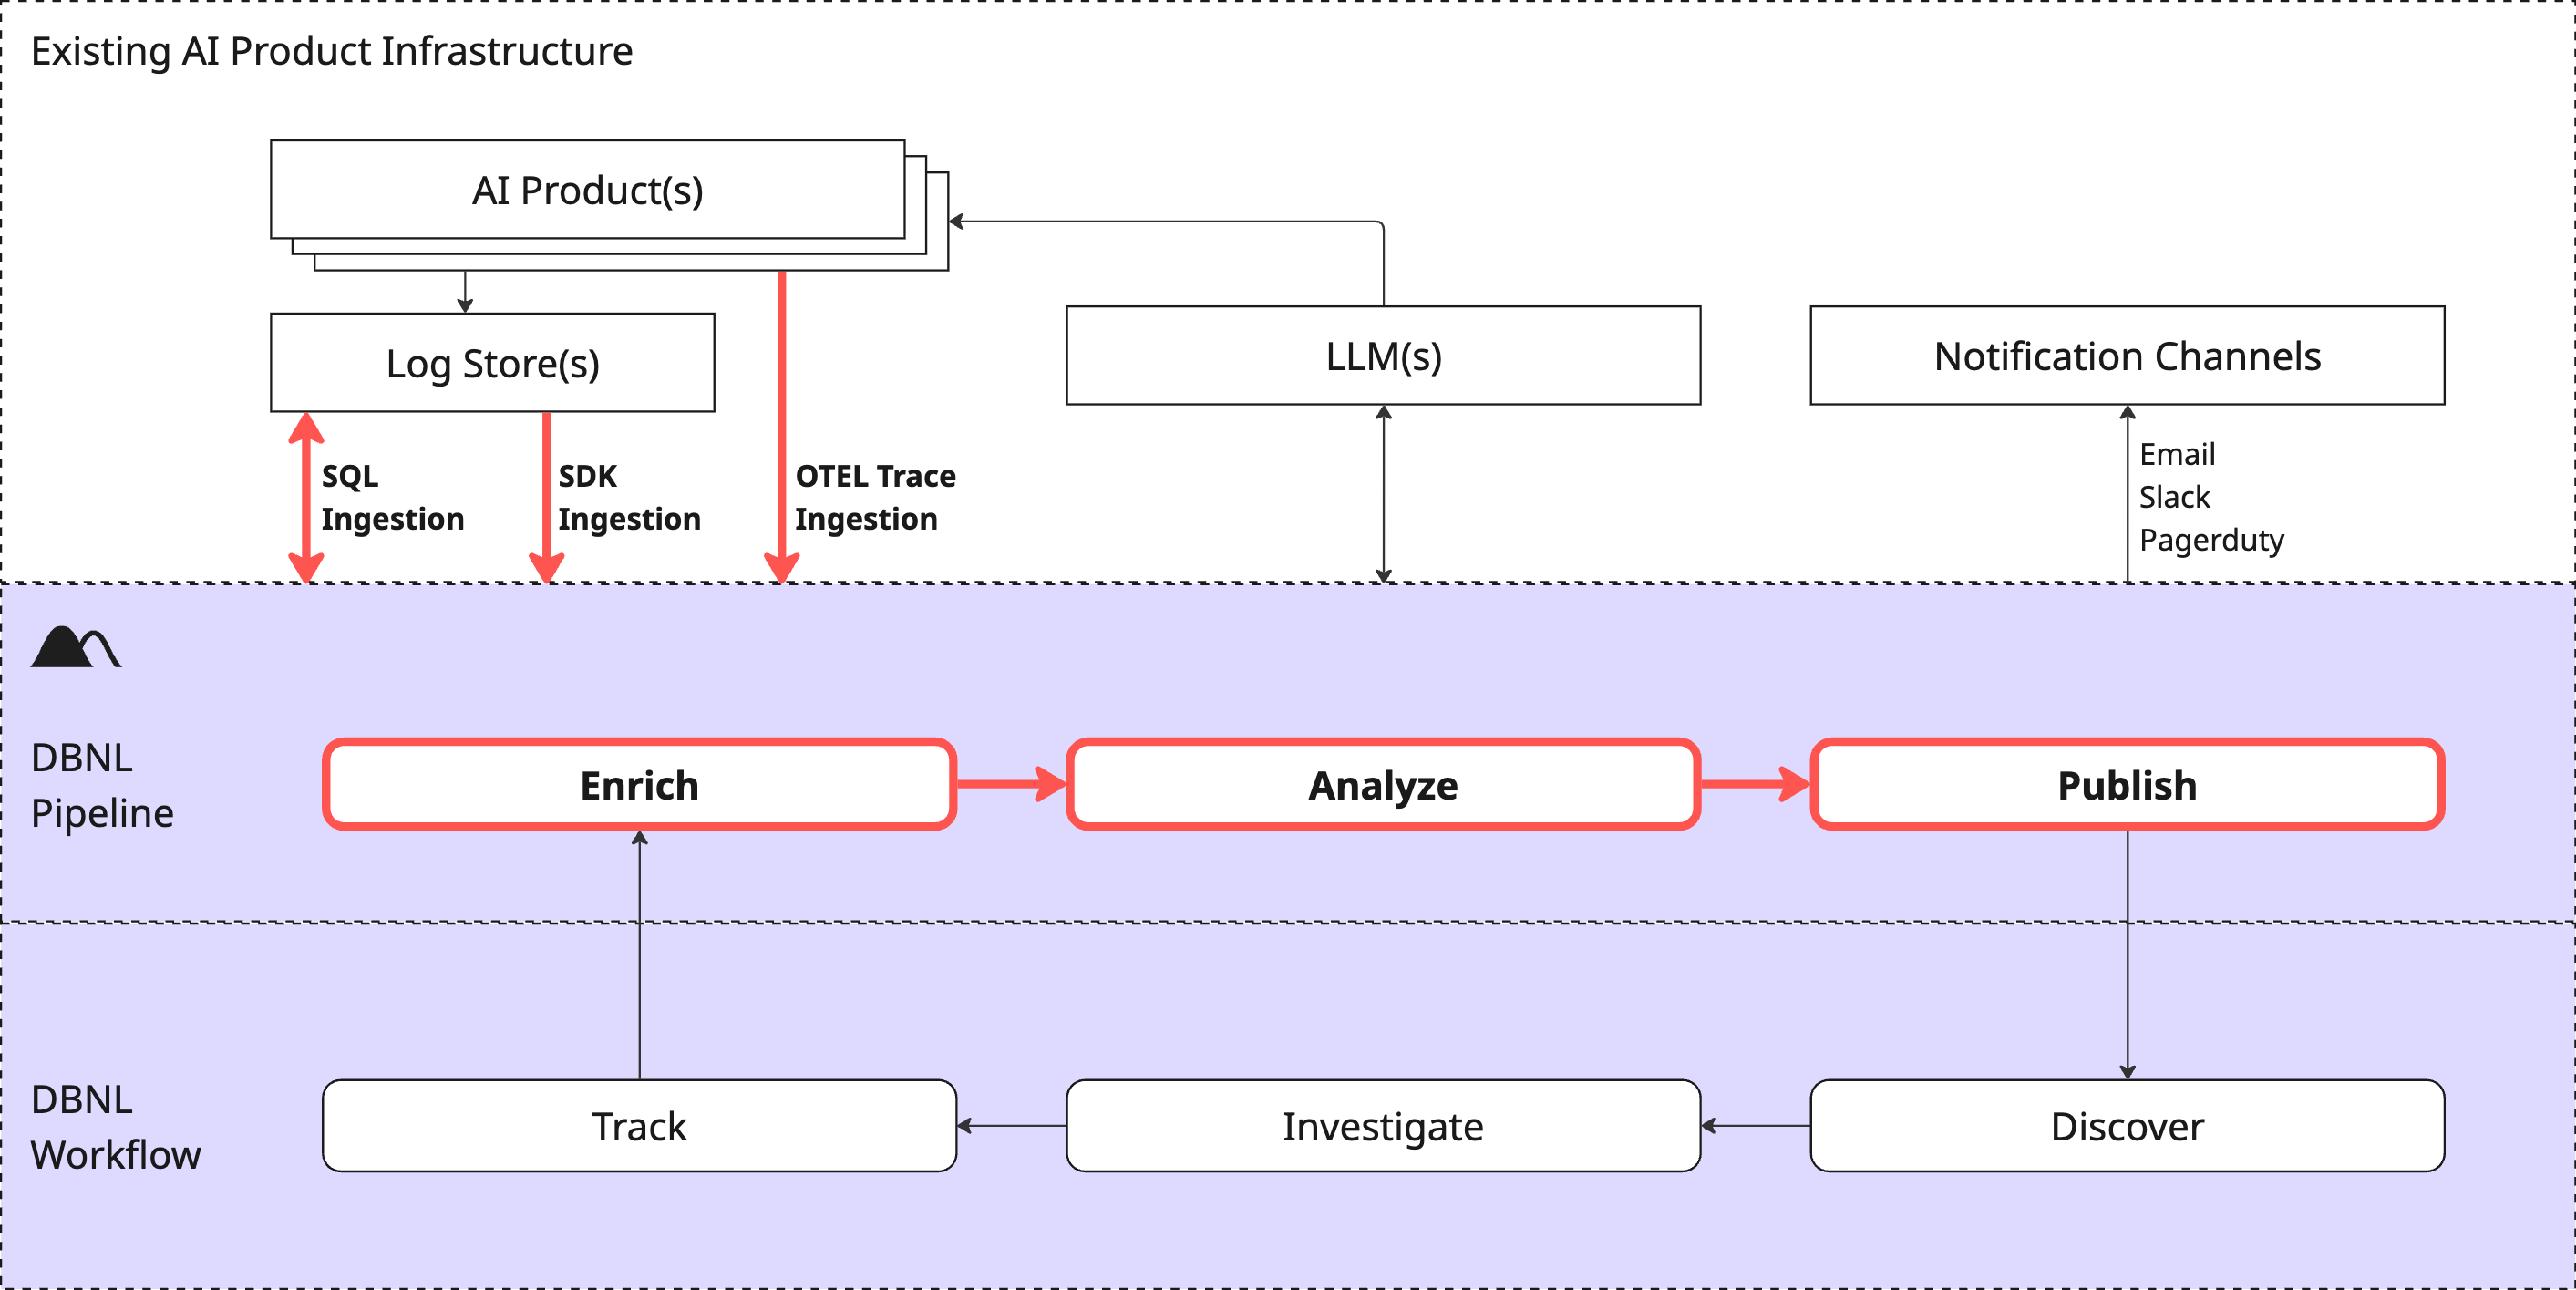
A DBNL Data Pipeline Run performs the following tasks:
1. **Ingest**: Raw production log data is flattened into [Columns](#columns). By using the [DBNL Semantic Convention](https://docs.dbnl.com/configuration/dbnl-semantic-convention) certain [Columns](#columns) can have rich semantic meaning and allow for deeper [Insights](https://docs.dbnl.com/workflow/insights) to be generated.
2. **Enrich**: [Metrics](https://docs.dbnl.com/workflow/metrics) are computed on the ingested log data, creating [Columns](#columns) in each log line corresponding to each computed Metric.
3. **Analyze**: Various unsupervised learning techniques are applied to the enriched log data to discover behavioral signals corresponding to shifts, segments, or outliers in behavior as [Insights](https://docs.dbnl.com/workflow/insights).
4. **Publish**: [Insights](https://docs.dbnl.com/workflow/insights) and updated charts are published to [Dashboards](https://docs.dbnl.com/workflow/dashboards) for consumption by the user.
Regardless of Ingestion method, the DBNL Data Pipeline ensures that all data is mapped to identical results tables and is treated the same for the purposes of the Analytics Workflow.
## Data Model
### Columns
A single log represents the captured behavior from a production AI product. Data from each log is flattened into multiple Columns, using the [DBNL Semantic Convention](https://docs.dbnl.com/configuration/dbnl-semantic-convention) whenever possible. The required Columns for a given log are:
* `input`: The text input to the LLM.
* `output`: The text response from the LLM.
* `timestamp`: The UTC timecode associated with the LLM call.
Only columns defined in the [DBNL Semantic Convention](https://docs.dbnl.com/configuration/dbnl-semantic-convention) are supported as top-level columns. To attach custom metadata, use span attributes via the [OpenInference semantic convention](https://github.com/Arize-ai/openinference).
### Metrics
[Metrics](https://docs.dbnl.com/workflow/metrics) are computed from Columns and appended as new Columns for each log.
### Segments
[Segments](https://docs.dbnl.com/workflow/segments) represent filters on Columns of Logs.
---
# Agent Instructions: Querying This Documentation
If you need additional information that is not directly available in this page, you can query the documentation dynamically by asking a question.
Perform an HTTP GET request on the current page URL with the `ask` query parameter:
```
GET https://docs.dbnl.com/configuration/data-pipeline.md?ask=
```
The question should be specific, self-contained, and written in natural language.
The response will contain a direct answer to the question and relevant excerpts and sources from the documentation.
Use this mechanism when the answer is not explicitly present in the current page, you need clarification or additional context, or you want to retrieve related documentation sections.