Reviewing Tests
Once you've created a Test Session, you can check it out in the UI!
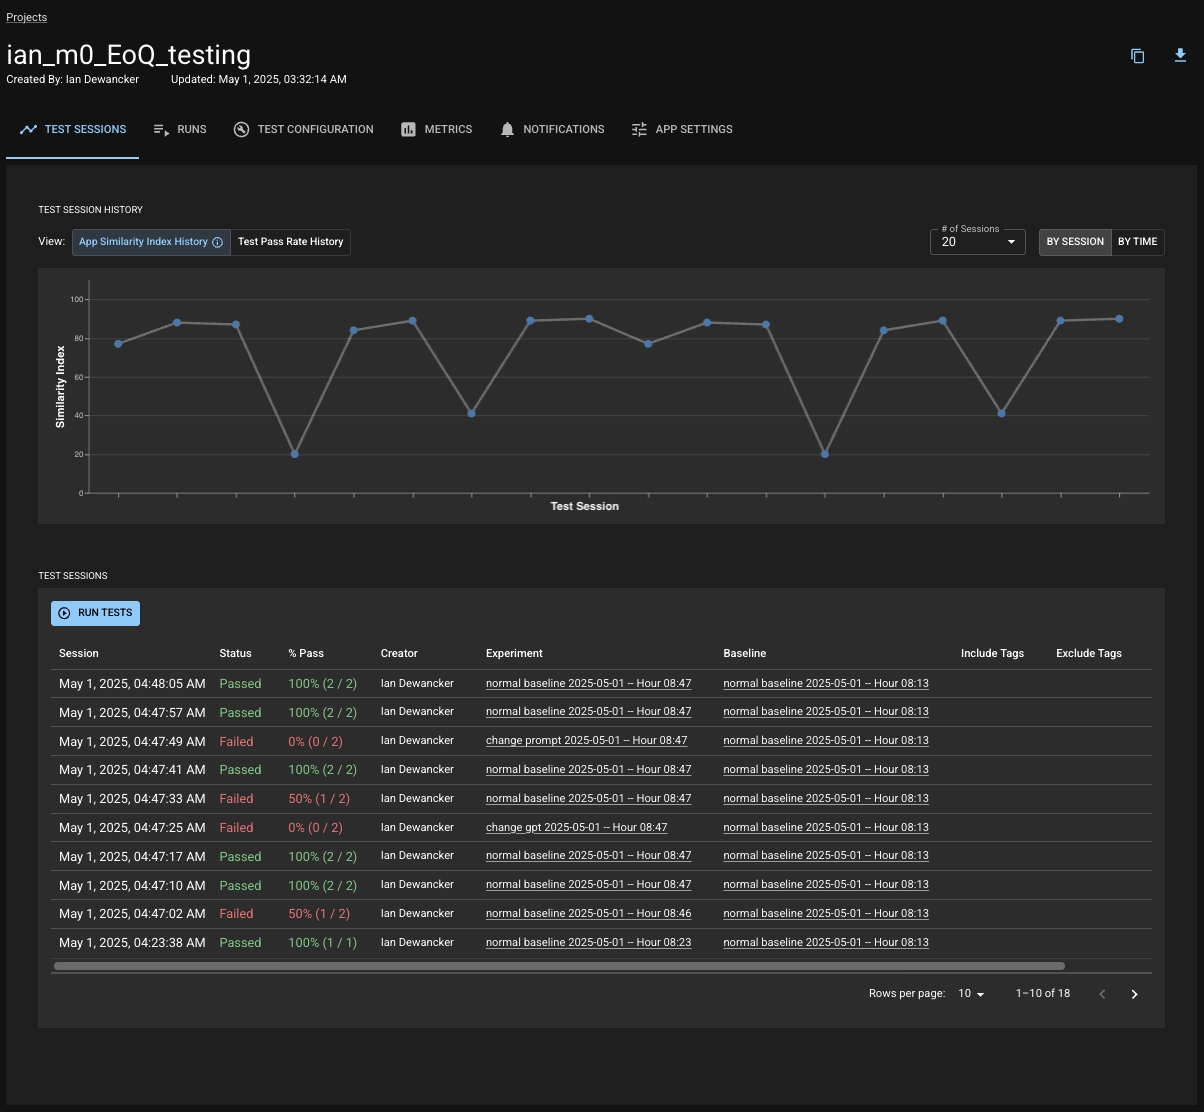
The Test Sessions section in your Project is a record of all the Test Sessions you've created. You can view a line chart of the pass rate of your Test Sessions over time or view a table with each row representing a Test Session You can click on a point in the chart or a row in the table to navigate to the corresponding Test Session's detail page to dig into what happened within that session.
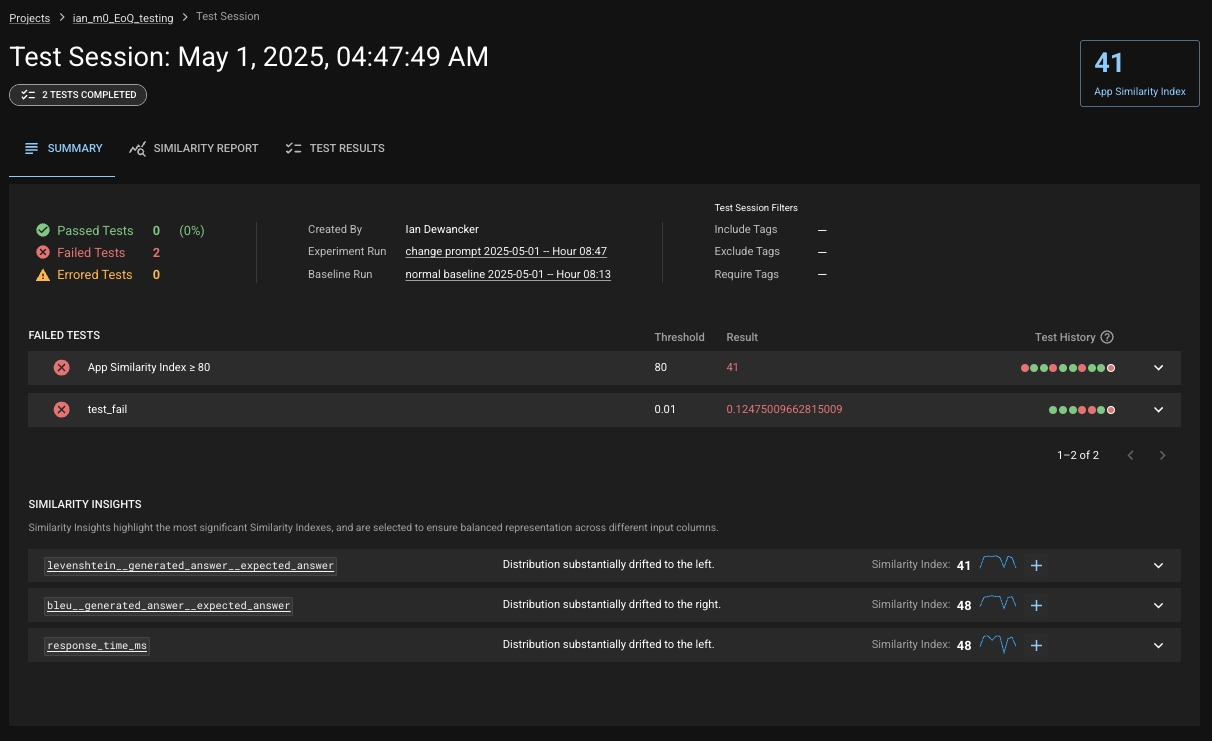
Test Session Summary
When you first open a Test Session's page, you will land on the Summary tab. This tab provides you with summary information about the session such as the App Similarity Index, which tests have failed, and insights about the session. There are also tabs to see the Similarity Report (more information below) or to view all the test results within the session.
Similarity Indexes
Across the Test Session page, you will see Similarity Indexes at both an "App" level as well as on each of your columns and metrics. This is a special summary score that DBNL calculates for you to help you quickly and easily understand how much your app has changed between the Experiment and Baseline Runs within the session, both holistically and at a granular level. You can define tests on any of the indexes — at the app level or on a specific metric or column. For more information, see the section "What Is a Similarity Index?".
Similarity Insights
On the Summary tab, you'll notice a list of insights that DBNL has discovered about your Test Session. These insights will tell you at a glance which columns or metrics have had the most significant change in your Experiment Run when compared to the baseline. If you are particularly interested in the column or metric going forward, you can quickly add a test for its Similarity Index.
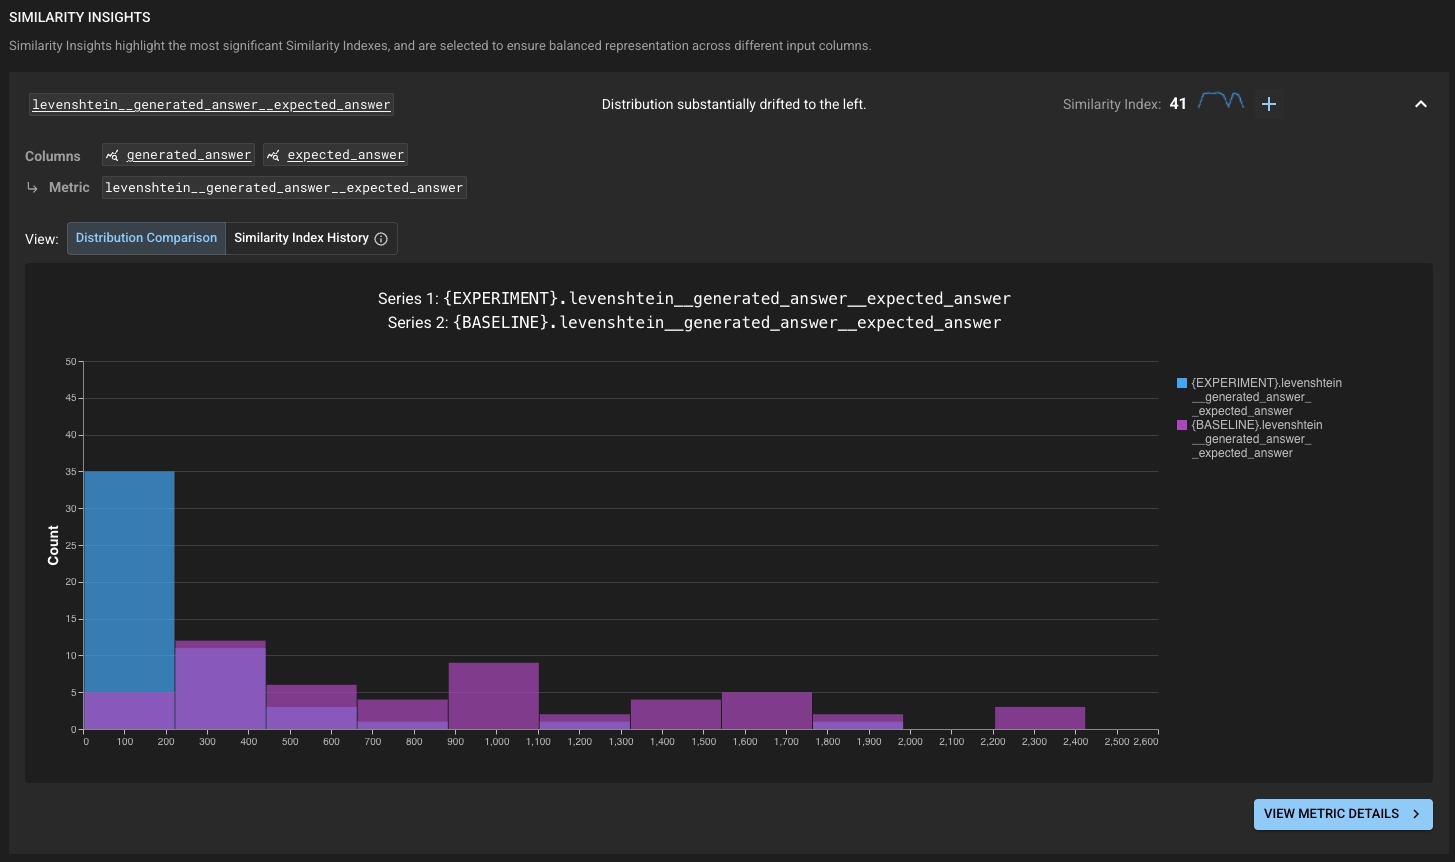
Expanding one of these will allow you to view some additional information such as a history of the Similarity Index for the related column or metric; if you are viewing a metric, it will also tell you the lineage of which columns the metric is derived from.
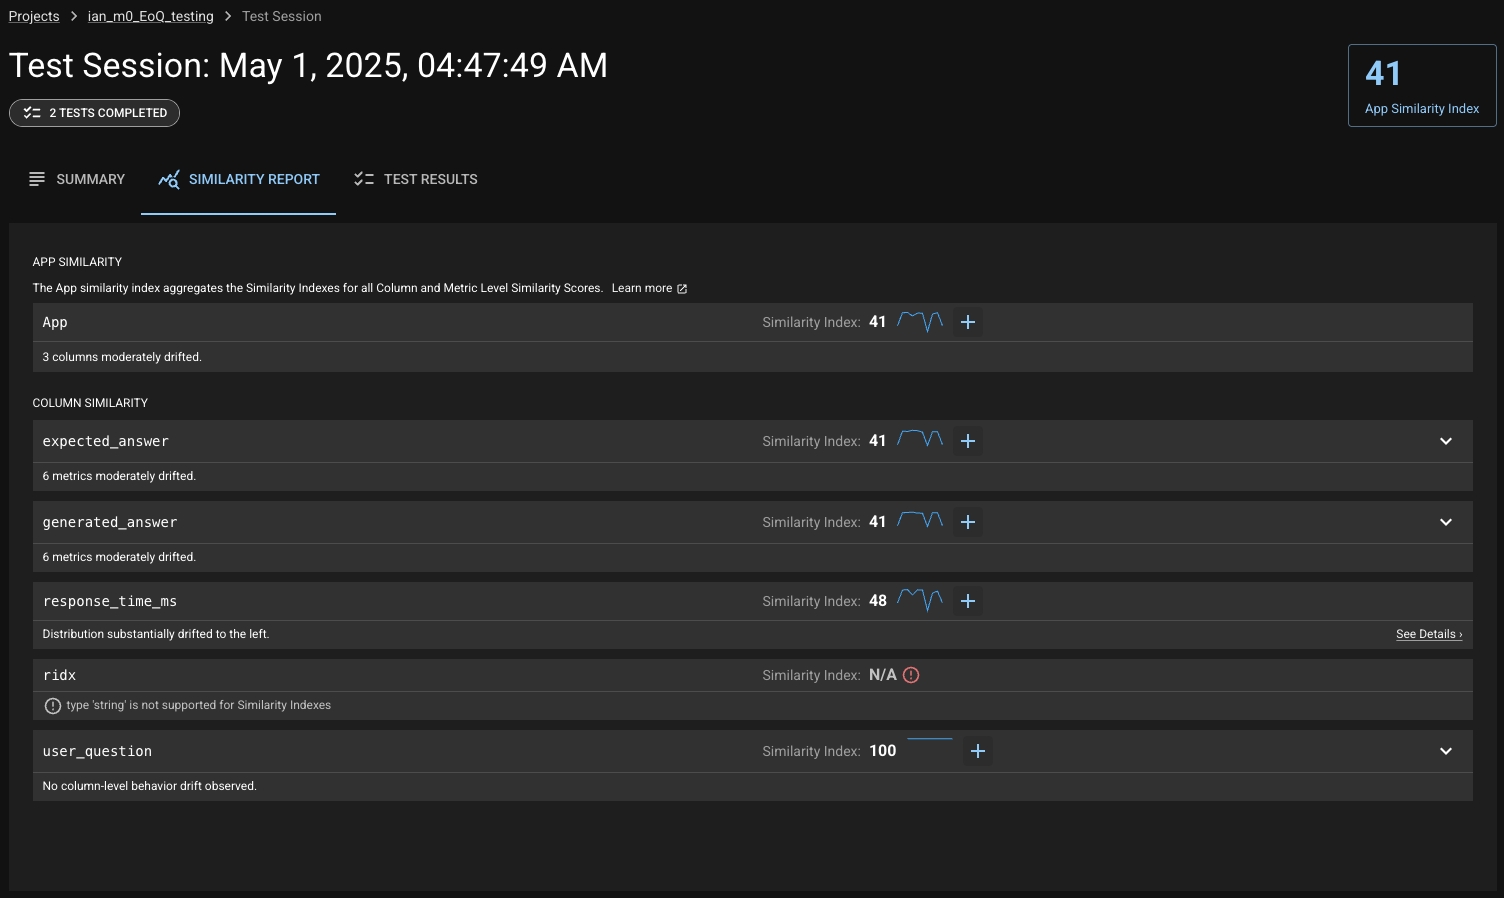
Similarity Report
The Similarity Report tab gives you an overview of all the columns your Experiment Run, providing the relevant Similarity Indexes, the ability to quickly create tests from them, and the option to deep-dive into a column. This deep-dive provides you with the tools to understand the Similarity Index value and investigate what has changed about the respective column. Expanding one of the rows for a column for show you all the metrics calculated for that column, with their own respective Similarity Indexes and details.
Column/Metric Overview
If you click on the "See Details" link on any of these rows (or from the Similarity Insights view), you'll be taken to a view that lets you explore the respective column or metric in detail.
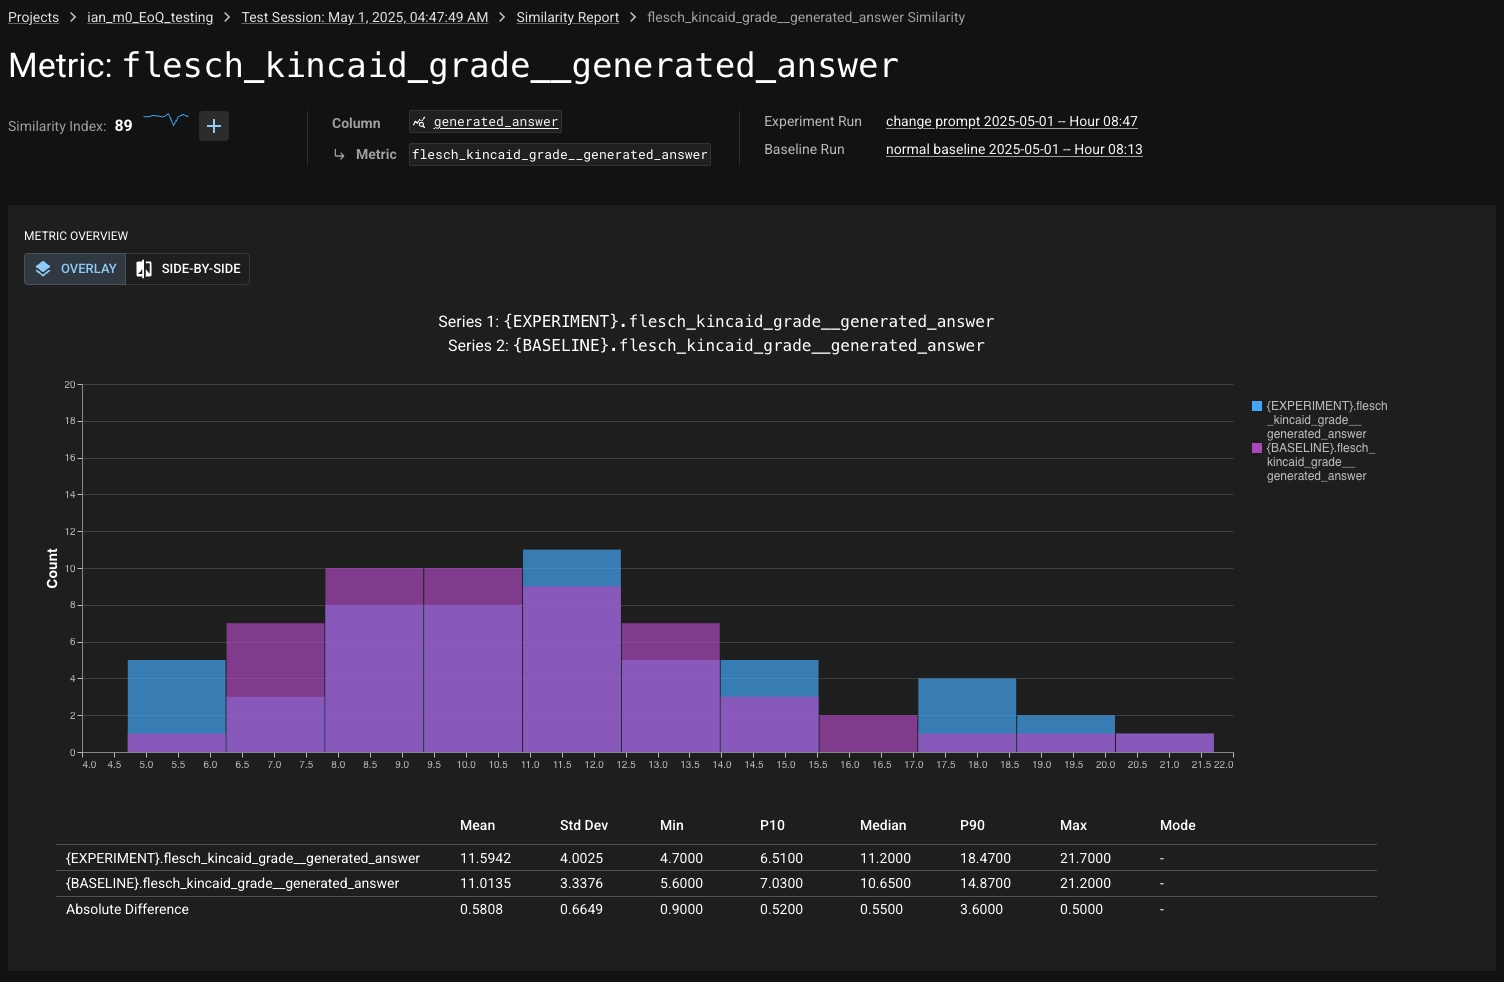
From this view, you can easily compare the changes in the column/metric with graphs and summary statistics. You can hover over a statistic in the table to quickly create a test from it.
Notable Results
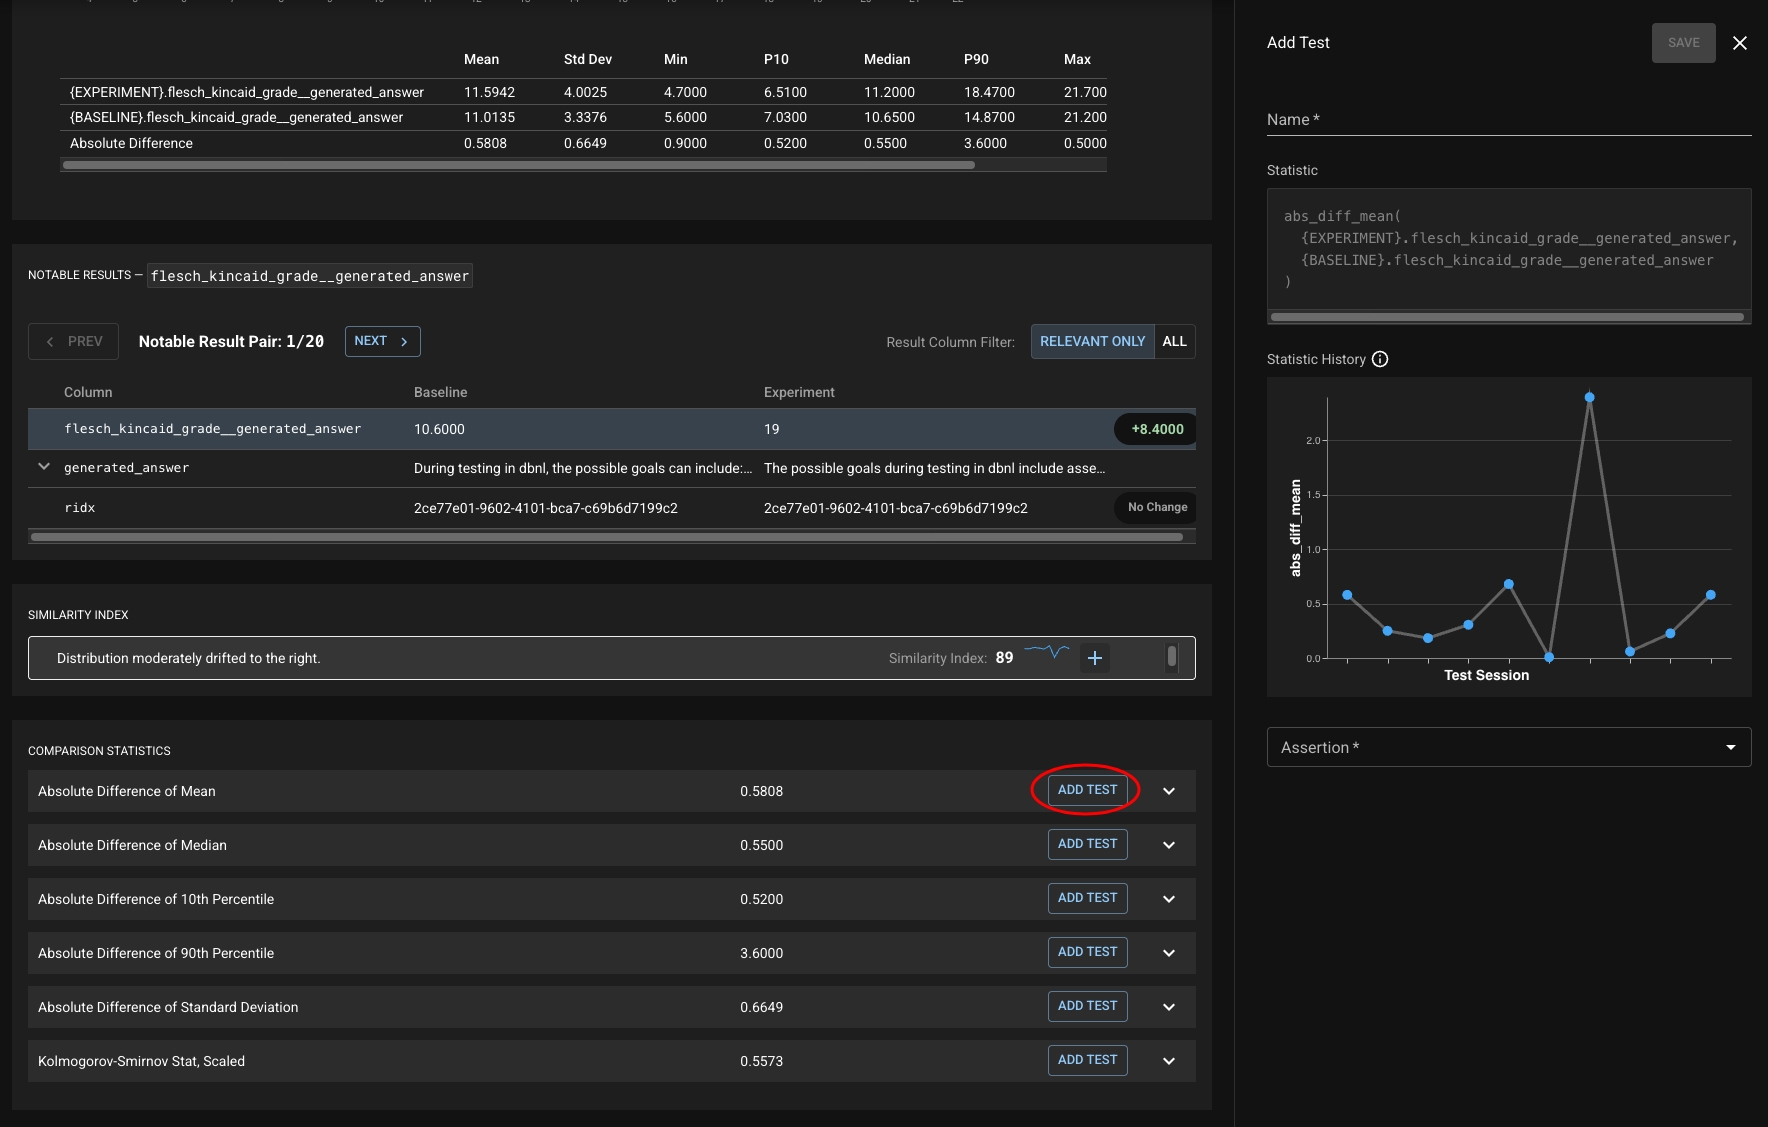
Just below the graph and chart, you'll see a list of "Notable Results". These are paired results from each Run — the Baseline and the Experiment — that DBNL thinks best illustrate the change in the column or metric you're viewing.

At a glance you can see the change in value, and you'll be shown any other columns/metrics that are relevant. If you'd like to see the entire row of data from the results, you can toggle the Result Column Filter to "ALL" and easily compare the two results.
Comparison Statistics
Keep scrolling and you'll see the Similarity Index and Insight, alongside a list of comparison statistics.
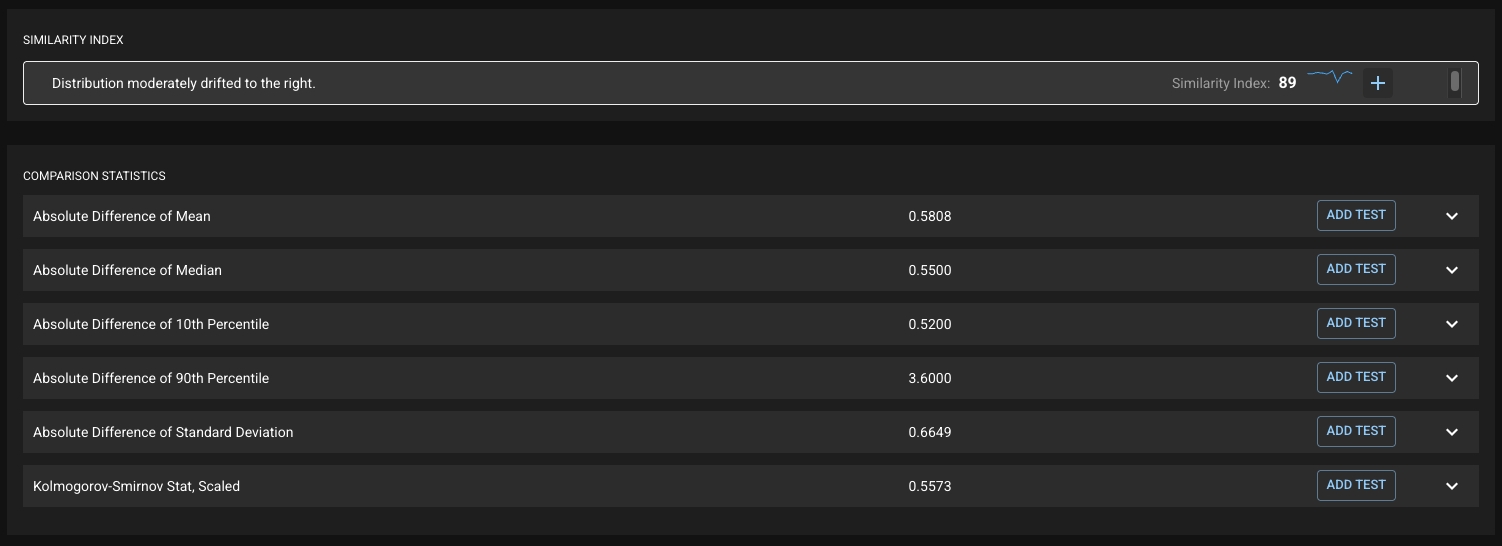
You can expand any of these for more details about the statistic. Clicking the "+" or any of the "Add Test" buttons will allow you to quickly create a test on that statistic. It will also show you a history of the values of that statistic over time in order to help you choose a threshold.
Test Results
The Test Results tab does what it advertises — shows you the results of any tests run in the Test Session! Here, you can see a summary of the test results at the top and a table of each individual test result. The table allows you to filter your tests in various ways and also shows the history of the test in recent Test Sessions.
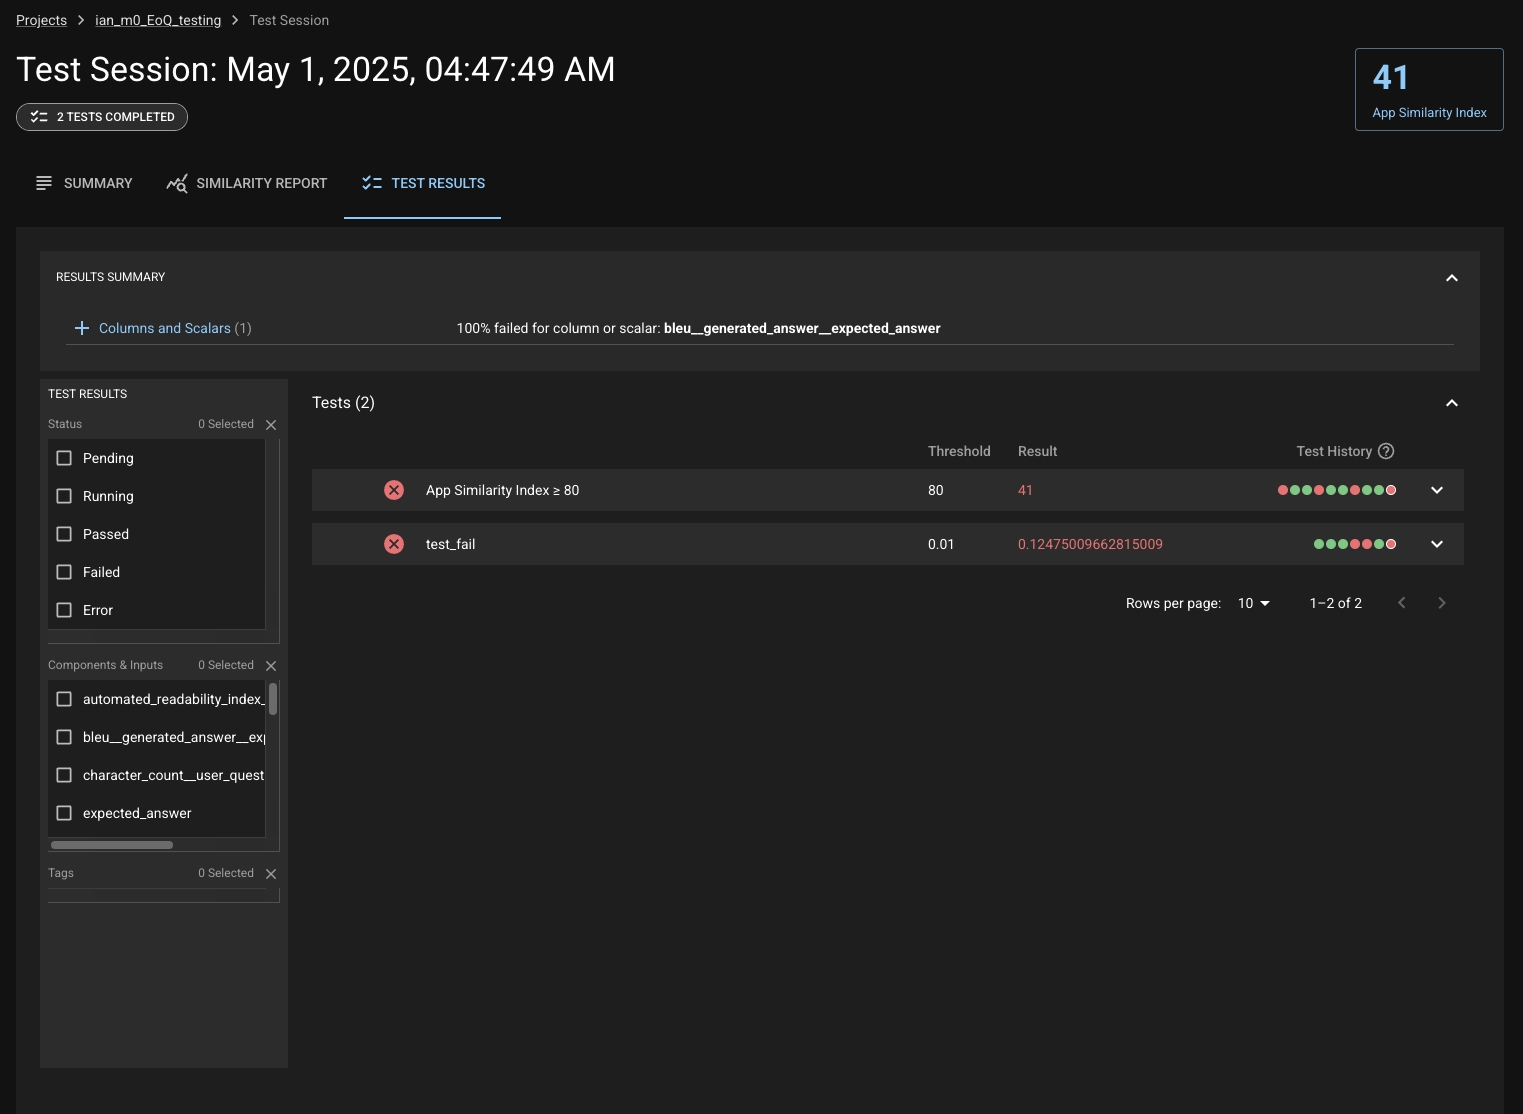
You can expand a test to see more information about it, edit it, or view its full history in more detail by clicking "View Test Details".

Was this helpful?

