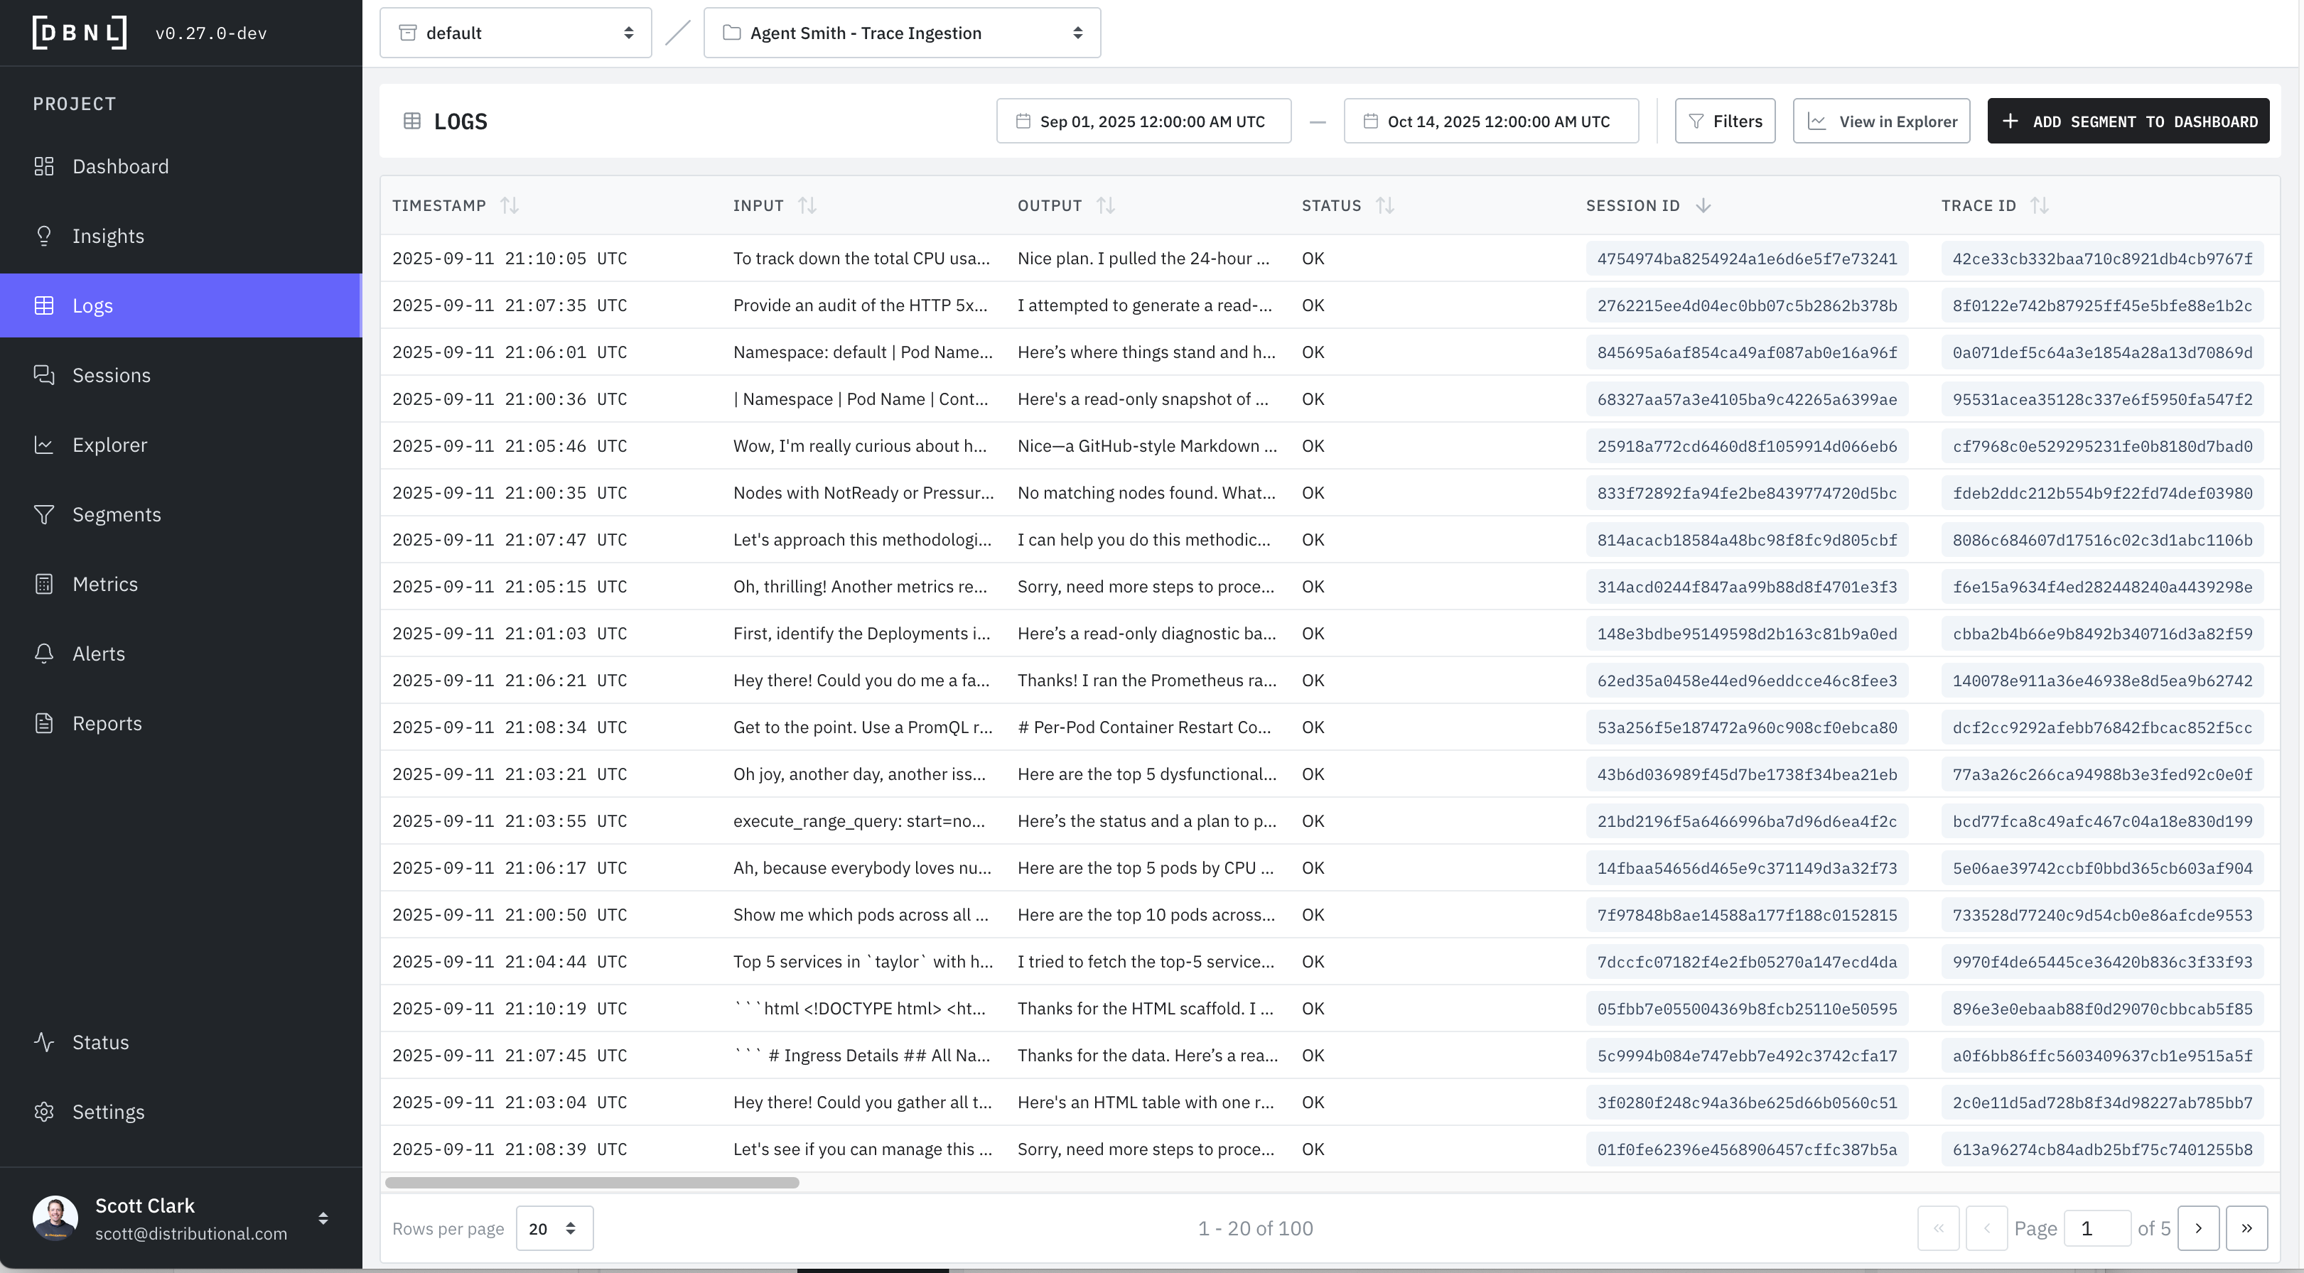
Logs
Filterable subsets of all ingested data and all generated Metrics
The Logs page allows the user to inspect specific logs with certain properties defined by
A specific time window (default: last 7 full days of data)
Individual Logs can be viewed in a variety of ways:
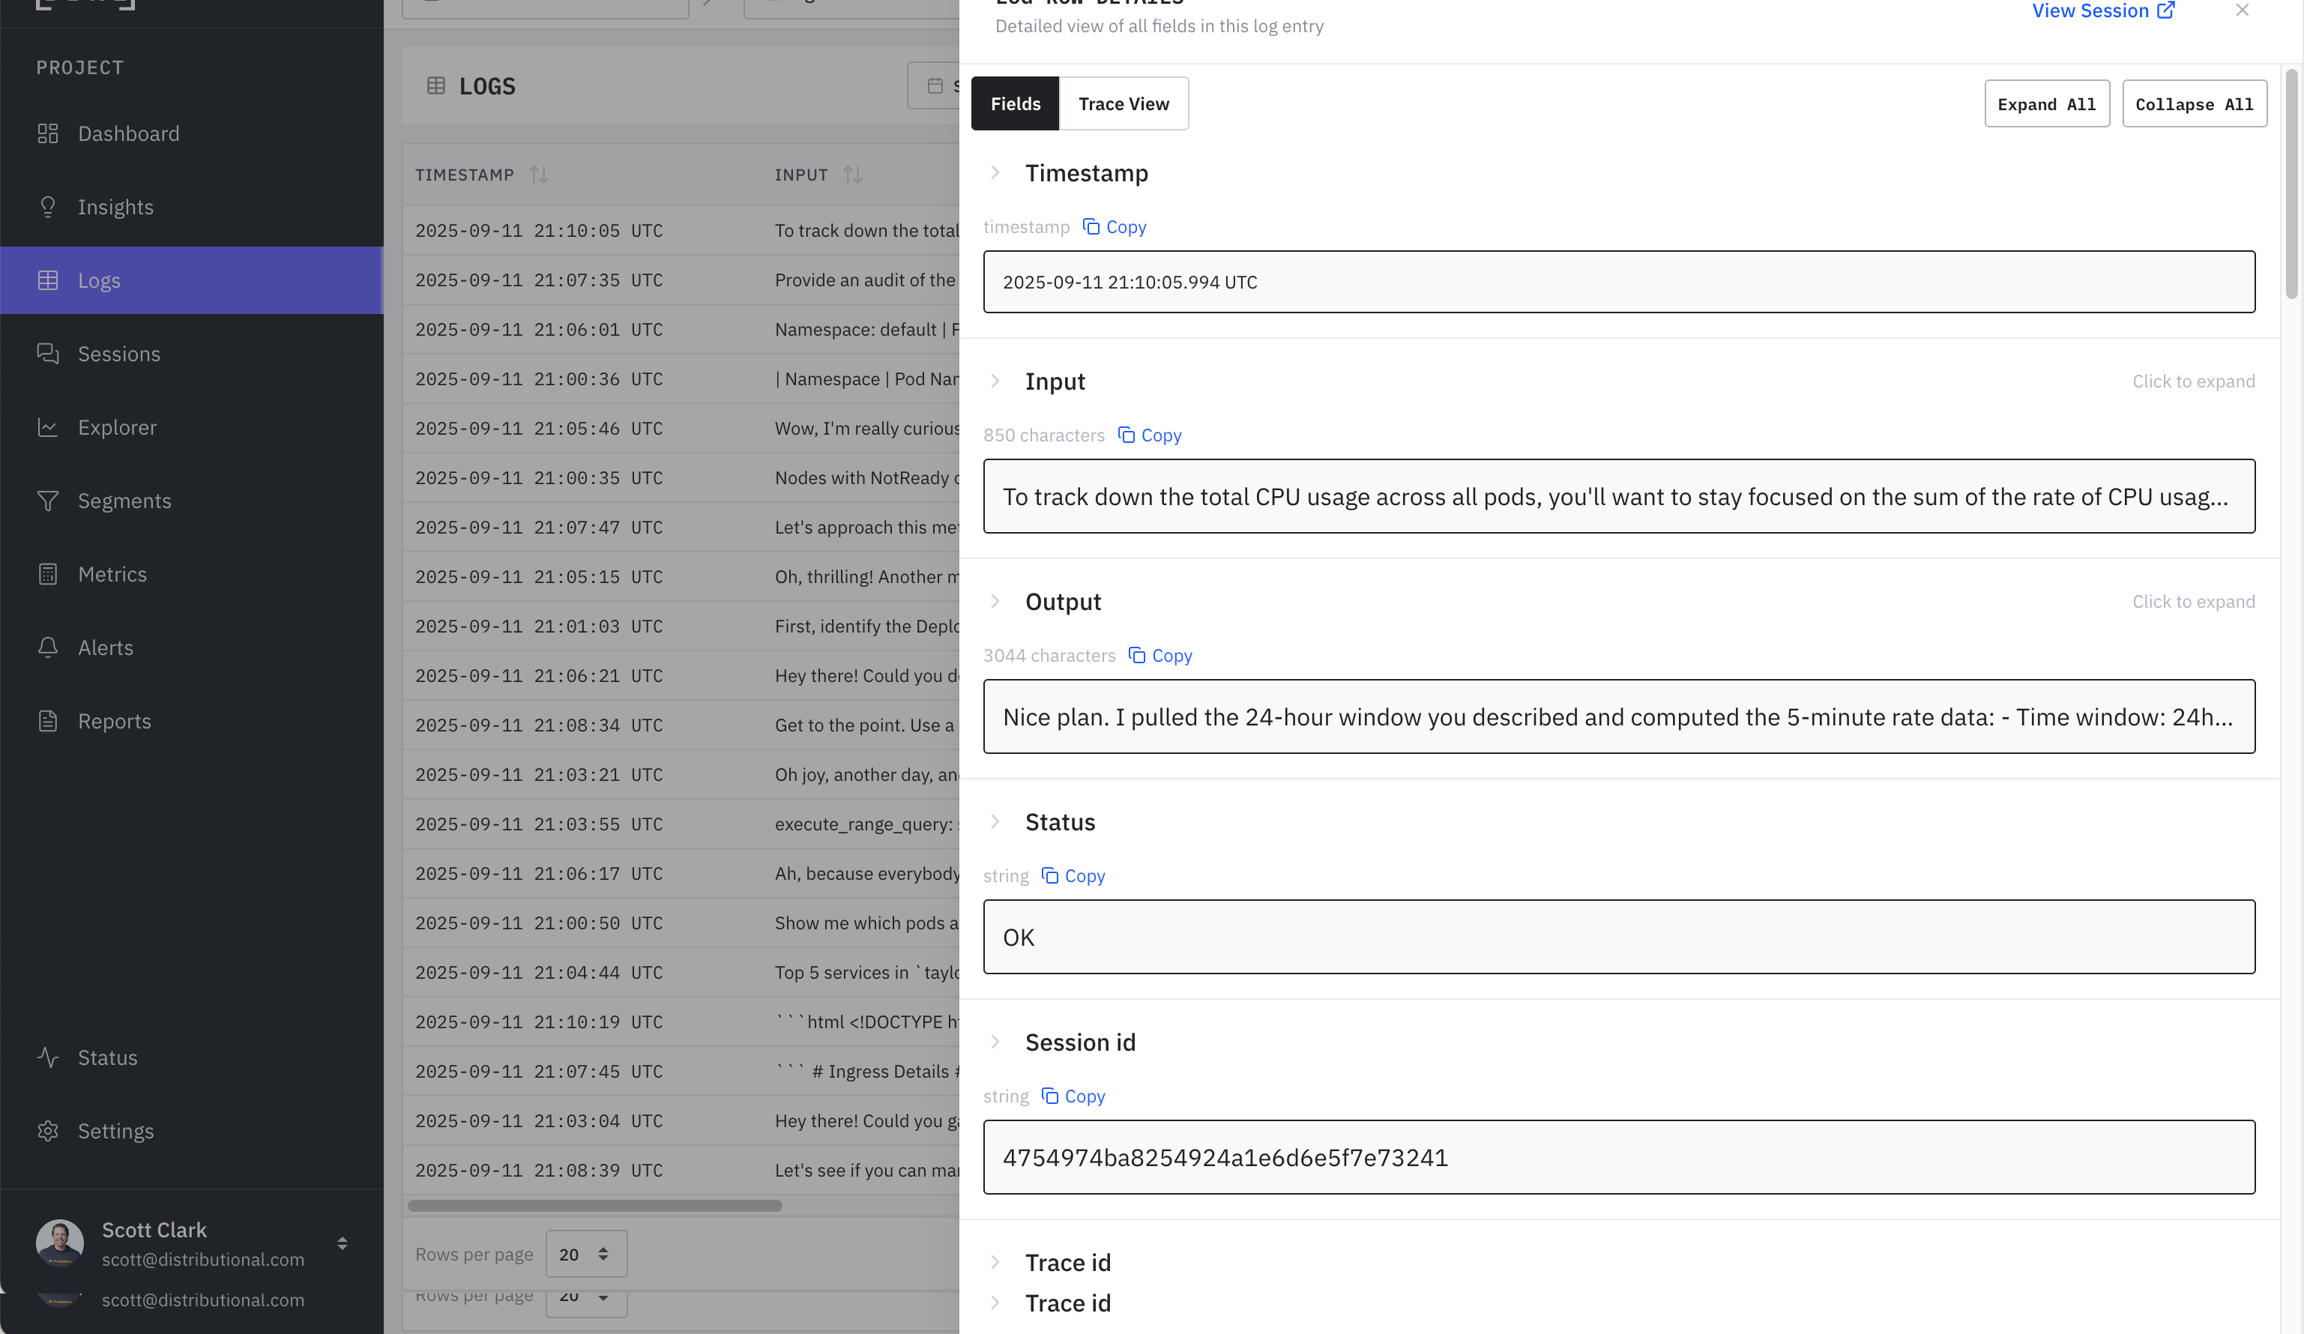
Detailed View: All Columns and Metrics of the log viewed together and optionally expanded.
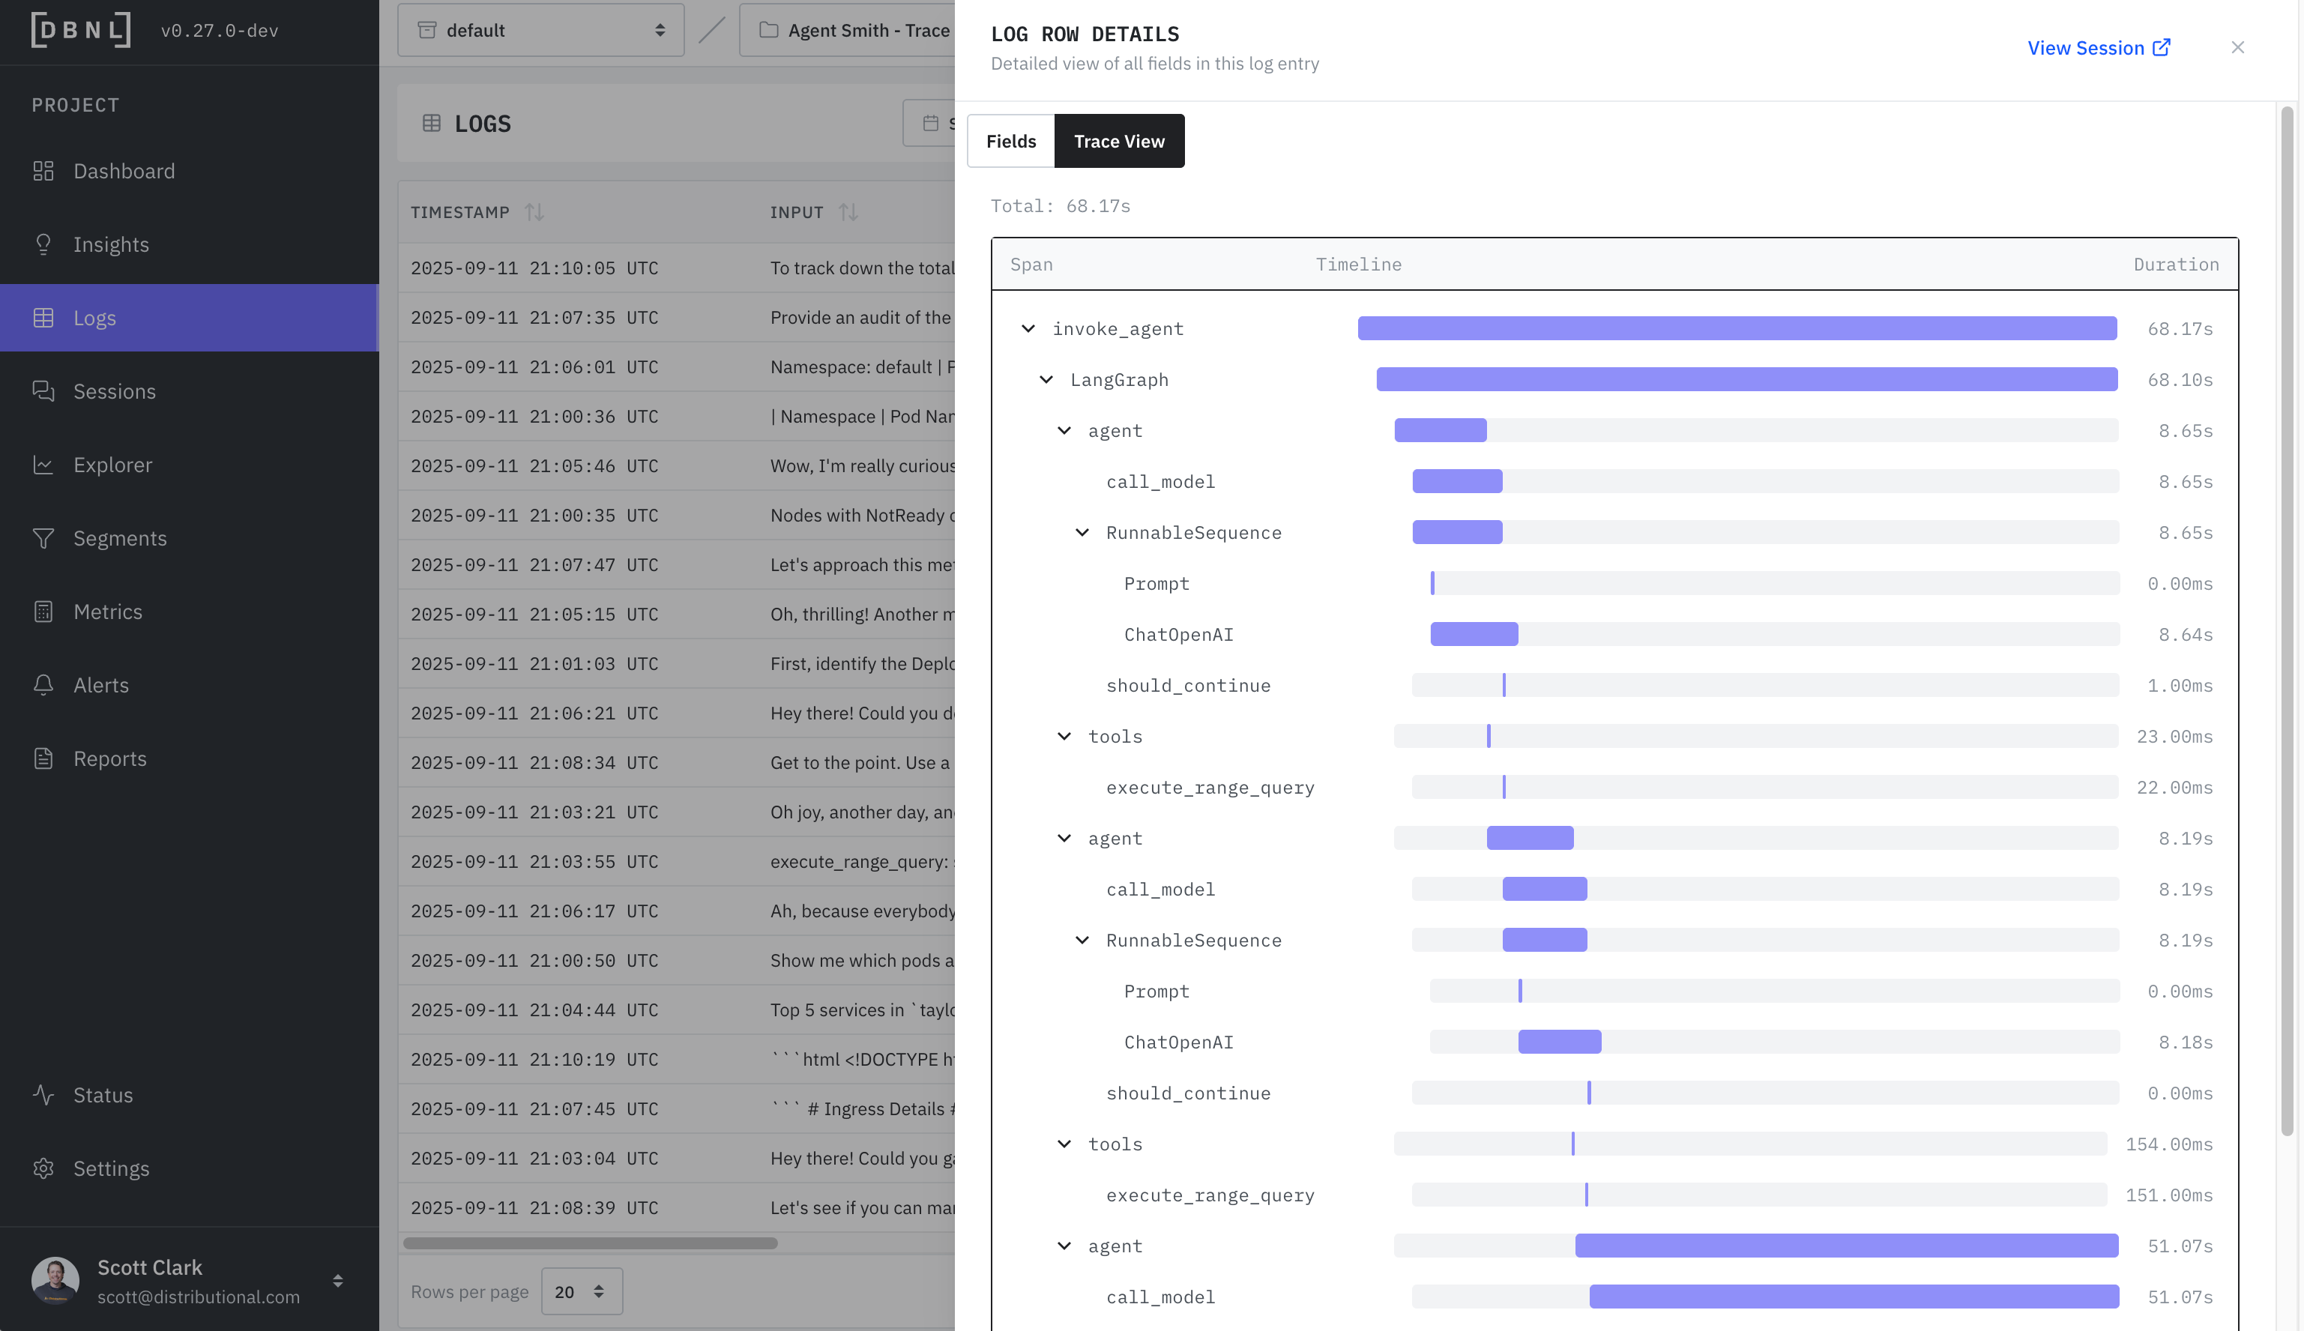
Trace View (if
spansprovided): The waterfall trace view of latency and timing for each individual span.Session View (if
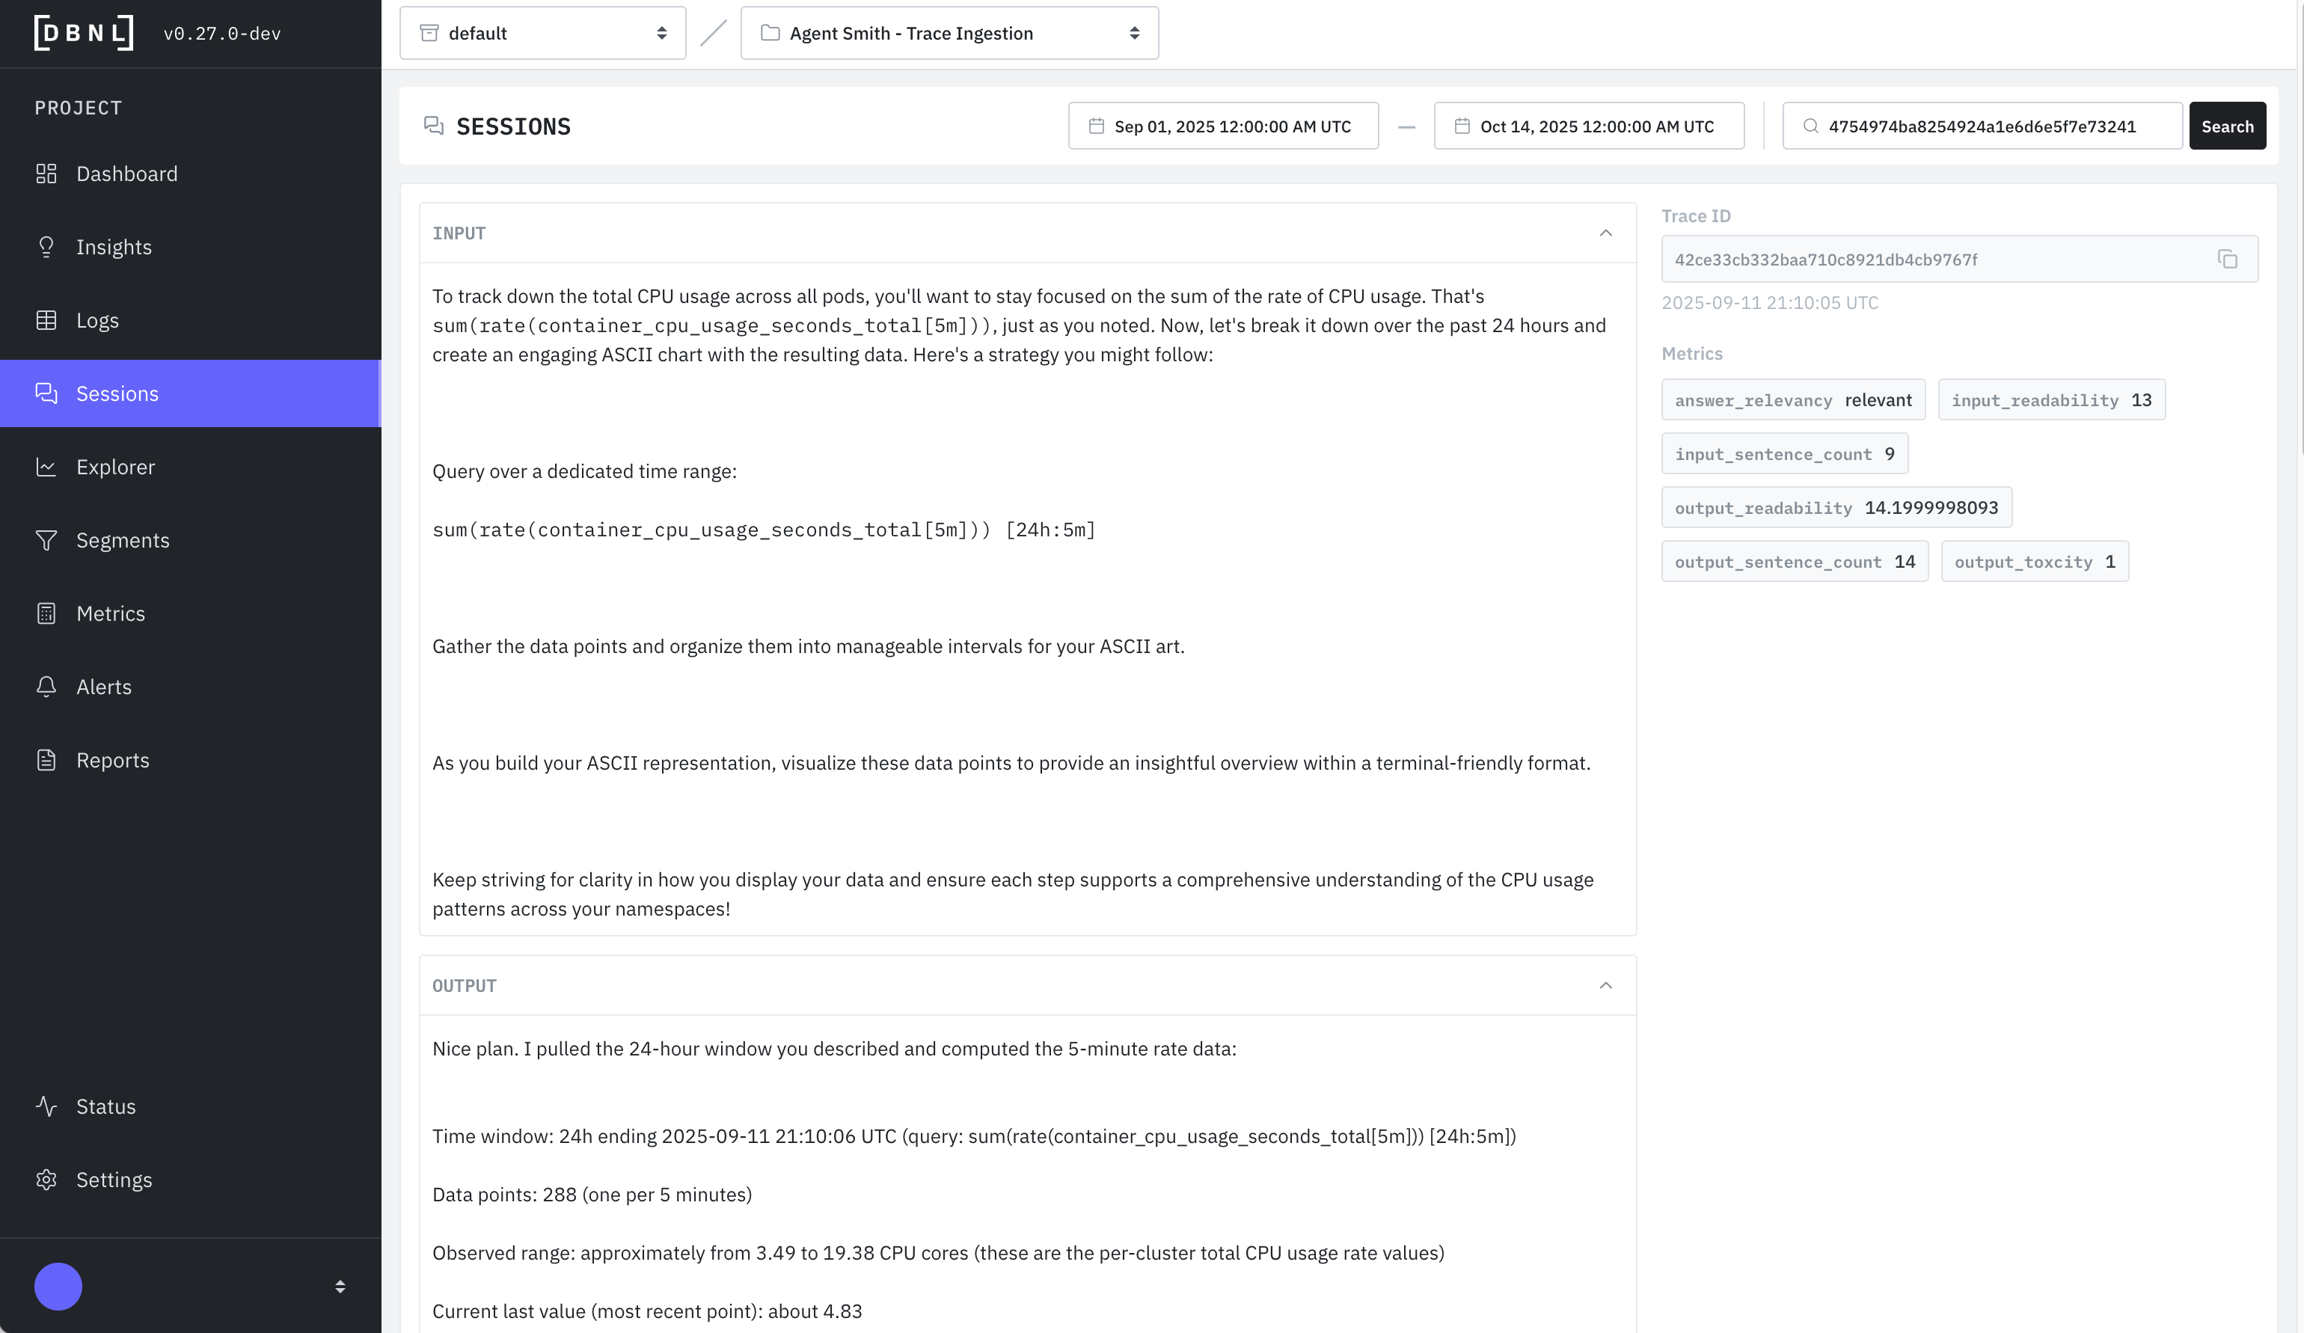
session_idprovided): All associated logs for the given session, along with Metrics.
As part of inspecting the logs the user can
View the filtered logs as charts and tables in the Explorer
Save the specific filters as a Segment to publish it on the Segments Dashboard

Log Detail View
All Columns and Metrics of the log viewed together and optionally expanded.

Log Trace View
The waterfall trace view of latency and timing for each individual span. Only available if spans was provided as part of the DBNL Semantic Convention.

Log Session View
All associated logs for the given session, along with Metrics. Only available if session_id was provided as part of the DBNL Semantic Convention.

Was this helpful?

