Customize how you want to be alerted to new Runs, new Test Sessions, and high severity failures
Distributional analyzes your data and executes your tests, but we also want to alert you about the status of your tests and the health of your app as new data arrives. We provide a notifications suite, to enable you to receive updates about your app’s health as you desire.
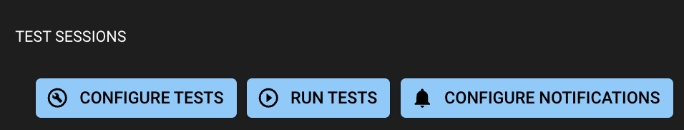
Notifications are configured as part of a Project, as seen in the screenshot above. When a test session fails by some predefined margin (e.g., more than 20% failures), members of your team can receive an alert, such as a Pagerduty. Or, if certain tests concern only certain members of your team, notifications to those members can be limited to only those tests failing.
Learn more about notifications .
Directing dbnl to execute the tests you want
A key part of the dbnl offering is the creation of automated Production tests. After their creation, each Test Session offers you the opportunity to Recalibrate those tests to match your expectations. For GenAI users, we think of this as the opportunity to “codify your vibe checks” and make sure future tests pass or fail as you see fit.
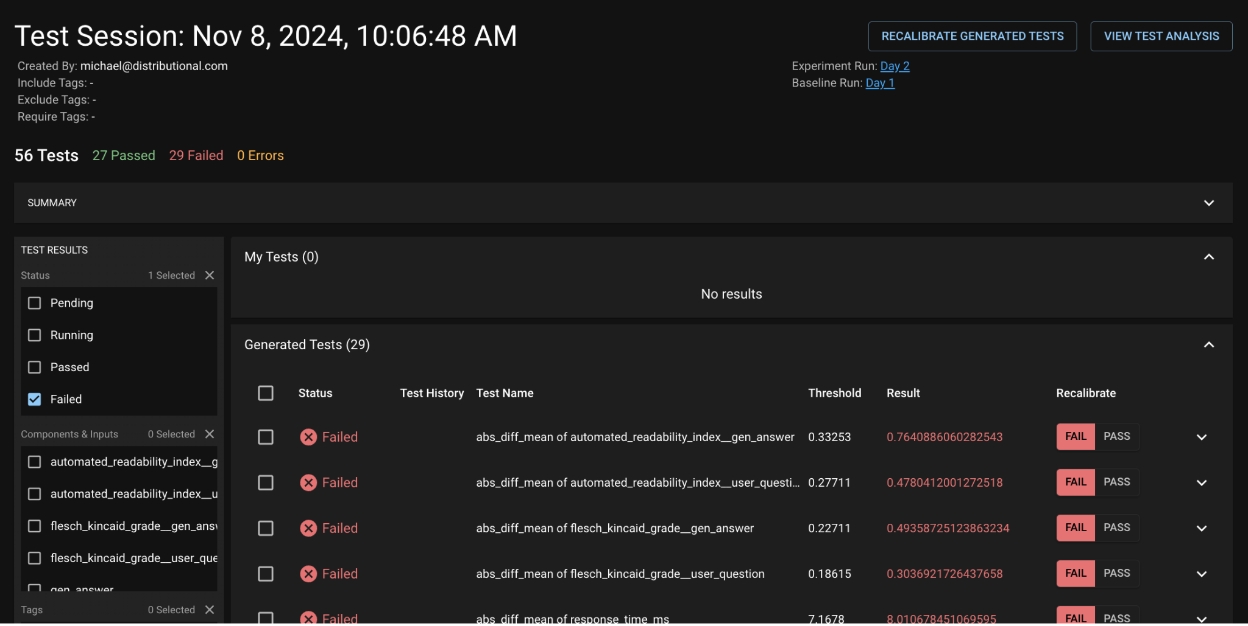
The previous section showed a brief snapshot of a test session to understand how your app has been performing. Our UI also provides advanced capabilities that allow you to dig deeper into our automated Production tests. Below we can see a sample Test Session with a suite of dbnl-generated tests. The View Test Analysis button lets you dig deeper into any subset of tests – in this image, we have subselected only the failed tests to try and learn whether there is something sufficiently concerning that should fail.
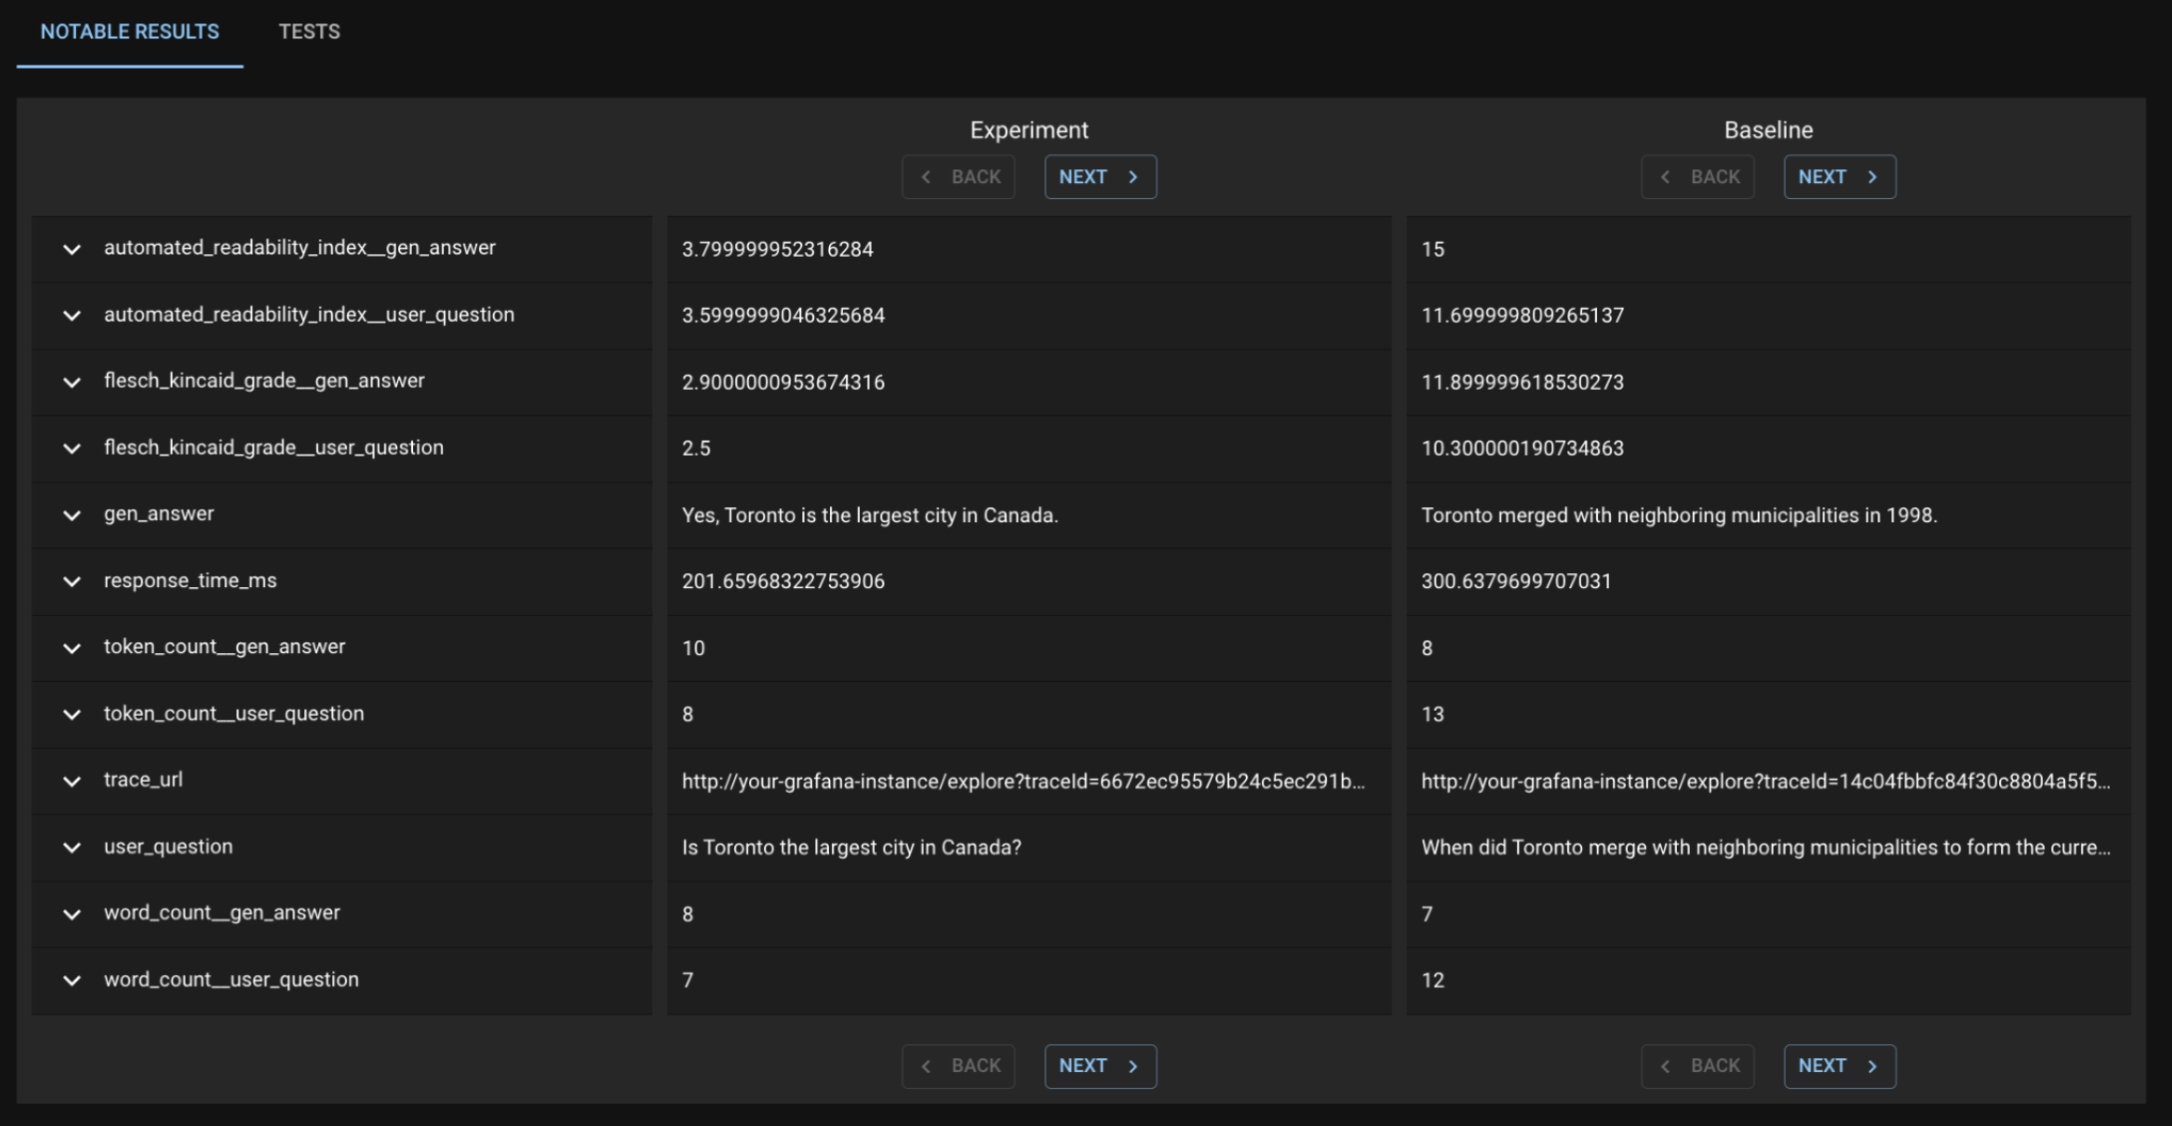
In the subsequent page, there is a Notable Results tab where dbnl provides a subset of app usages that we feel are the most extremely different between the Baseline and Experiment run. When you leaf through these Question/Answer pairs, we do not see anything terribly frightening— just the standard randomness of LLMs. As such, on the original page, I choose to Recalibrate Generated Tests to pass, and I will not be alerted in the future.
We recommend that you always inspect the first 4-7 test sessions for a new Project. This helps ensure that the tests effectively incorporate the nondeterministic nature of your app. After those initial Recalibration actions, you can define notifications to only trigger when too many tests fail.
Test sessions provide an opportunity to learn about your app's behavior
After you define and execute tests, dbnl creates a Test Session to mark a permanent statement of how your app behaved relative to expectations. You can explore this Test Session, as well as the Runs that were tested, to learn about your app -- both its behavior and about how users interacted with it.
The is available for all tests, including any tests you may have created with . In this section, we highlight key insights that can be gained from the automated Production tests, insights from elsewhere in the Distributional UI, and how you can be notified about your Test Session status in whatever fashion you prefer.
Test Sessions are not the only place to learn about your app
Distributional’s goal is to provide you the ability to ask and answer the question “Is my AI-powered app behaving as expected?” While testing is a key component of this, triage of a failed test and inspiration for new tests can come from many places in our web UI. Here, we show insights into app behavior which are uncovered with Distributional.
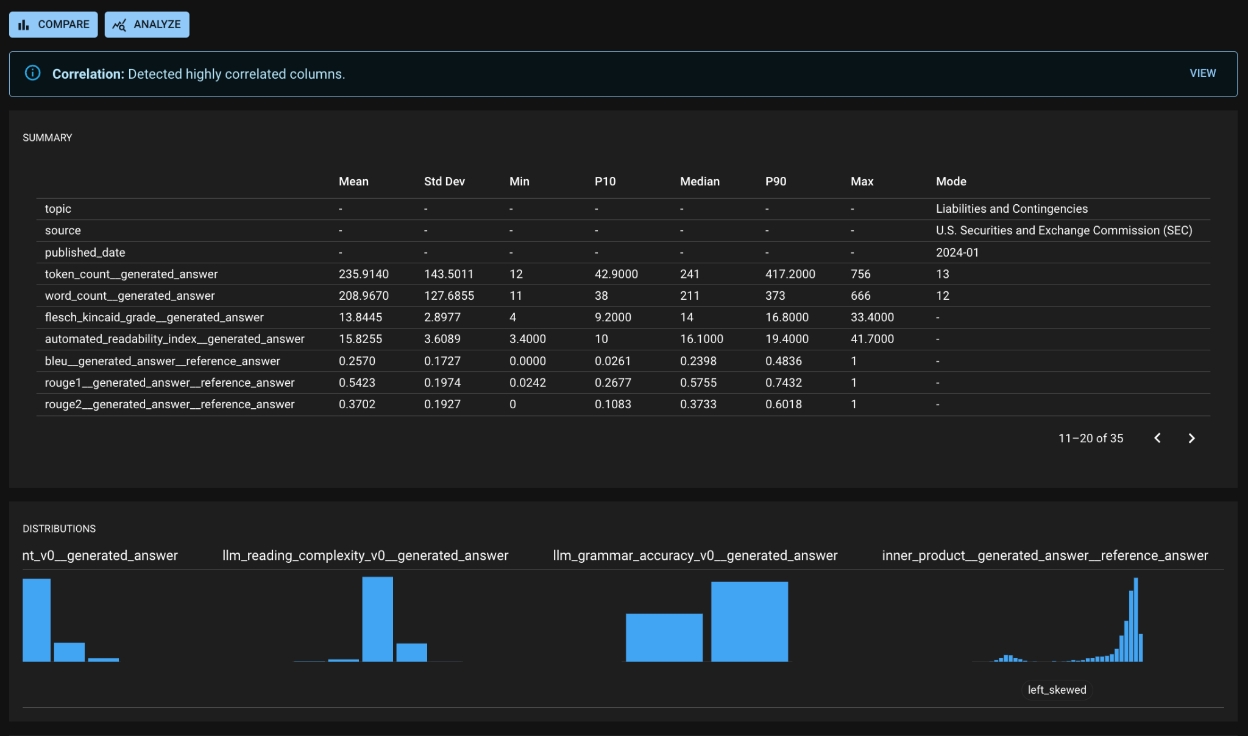
Because each Run represents the recent behavior of your app, the Run Detail page is a useful source of insights about your app’s behavior. In the screenshot below, you can see:
dbnl-generated alerts regarding highly correlated columns (in depth on a separate screen),
Summary statistics for columns (along with shortcuts to create tests for any statistics of note), and
Notable behavior for columns, such as a skewed or multimodal distribution.
At the top of the Run Detail page, there are links to the Compare and Analyze pages, where you can conduct more in depth and customized analysis. You can drive your own analysis at these pages to uncover key insights about your app.
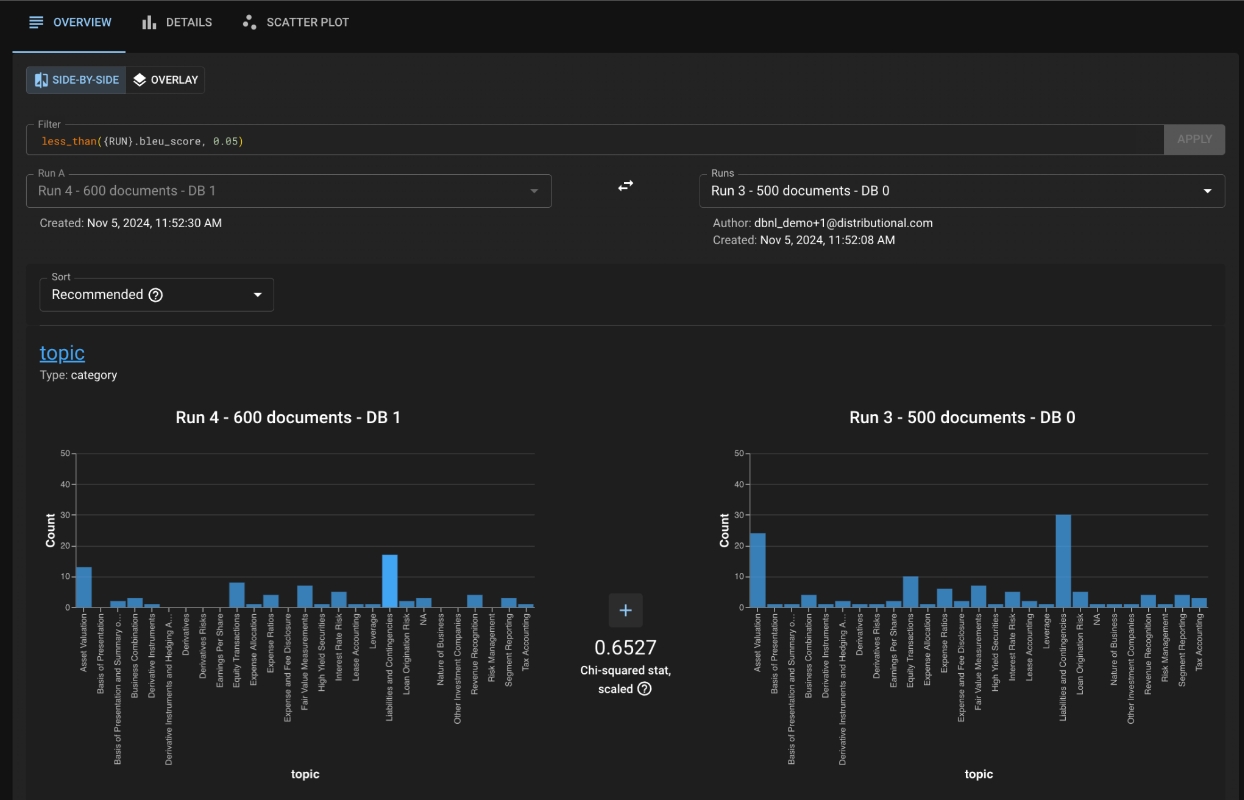
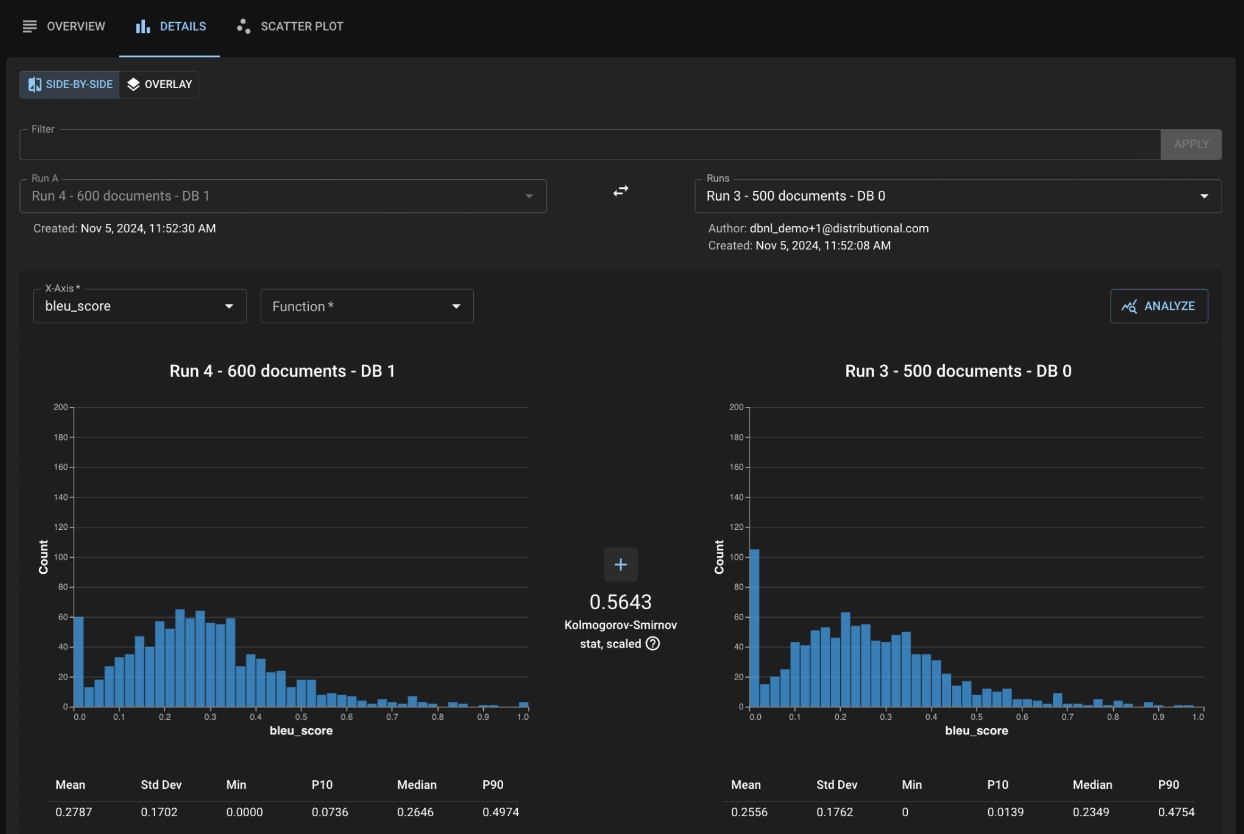
For example, after seeing a failed Test Session in a RAG (Q & A) application, you may visit the Compare page to understand the impact of adding new documents to your vector database. The image below shows a sample Compare page, which reveals a sizable decrease in the population of poorly-retrieved questions (drop in the low bleu value between Baseline and Experiment).
Filtering for those columns (the screenshot below) gives a valuable insight about the impact of the extra documents. You see that, previously, the RAG app was incorrectly retrieving documents from “Liabilities and Contingencies” as well as “Asset Valuations.” Adding the new documents improved your app’s quality, and now you can confidently answer, “Yes, my app’s behavior has changed, and I am satisfied with its new behavior.”