Loading...
Loading...
Loading...
Loading...
Loading...
Loading...
Loading...
Loading...
Loading...
Loading...
Loading...
Loading...
Loading...
Loading...
Loading...
Loading...
Loading...
Loading...
Loading...
Loading...
Loading...
Loading...
Loading...
Loading...
Loading...
Tests are the key tool within dbnl for asserting performance and consistency of runs. Possible goals during testing can include:
Asserting that a chosen column meets its minimum desired behavior (e.g., inference throughput);
Asserting that a chosen column has a distribution that roughly matches the baseline reference;
Asserting that no individual results have a severely divergent behavior from a baseline.
In this section, we explore the objects required for testing, methods for creating tests, suggested testing strategies, reviewing/analyzing tests, and best practices.
There are several ways for dbnl users to create tests, each of which may be useful in different circumstances and for different users within the same organization.
Tests can be programmatically created using the python SDK. Users must provide a JSON dictionary that adheres to the dbnl Test Spec and instantiates the key elements of a Test. The Testing Strategies section has sample content around creating tests using JSON. Additionally, the test creation page will soon also have the ability to convert a test from dropdowns to JSON, so that many tests of similar structure can be created in JSON after the first one is designed in the web UI.
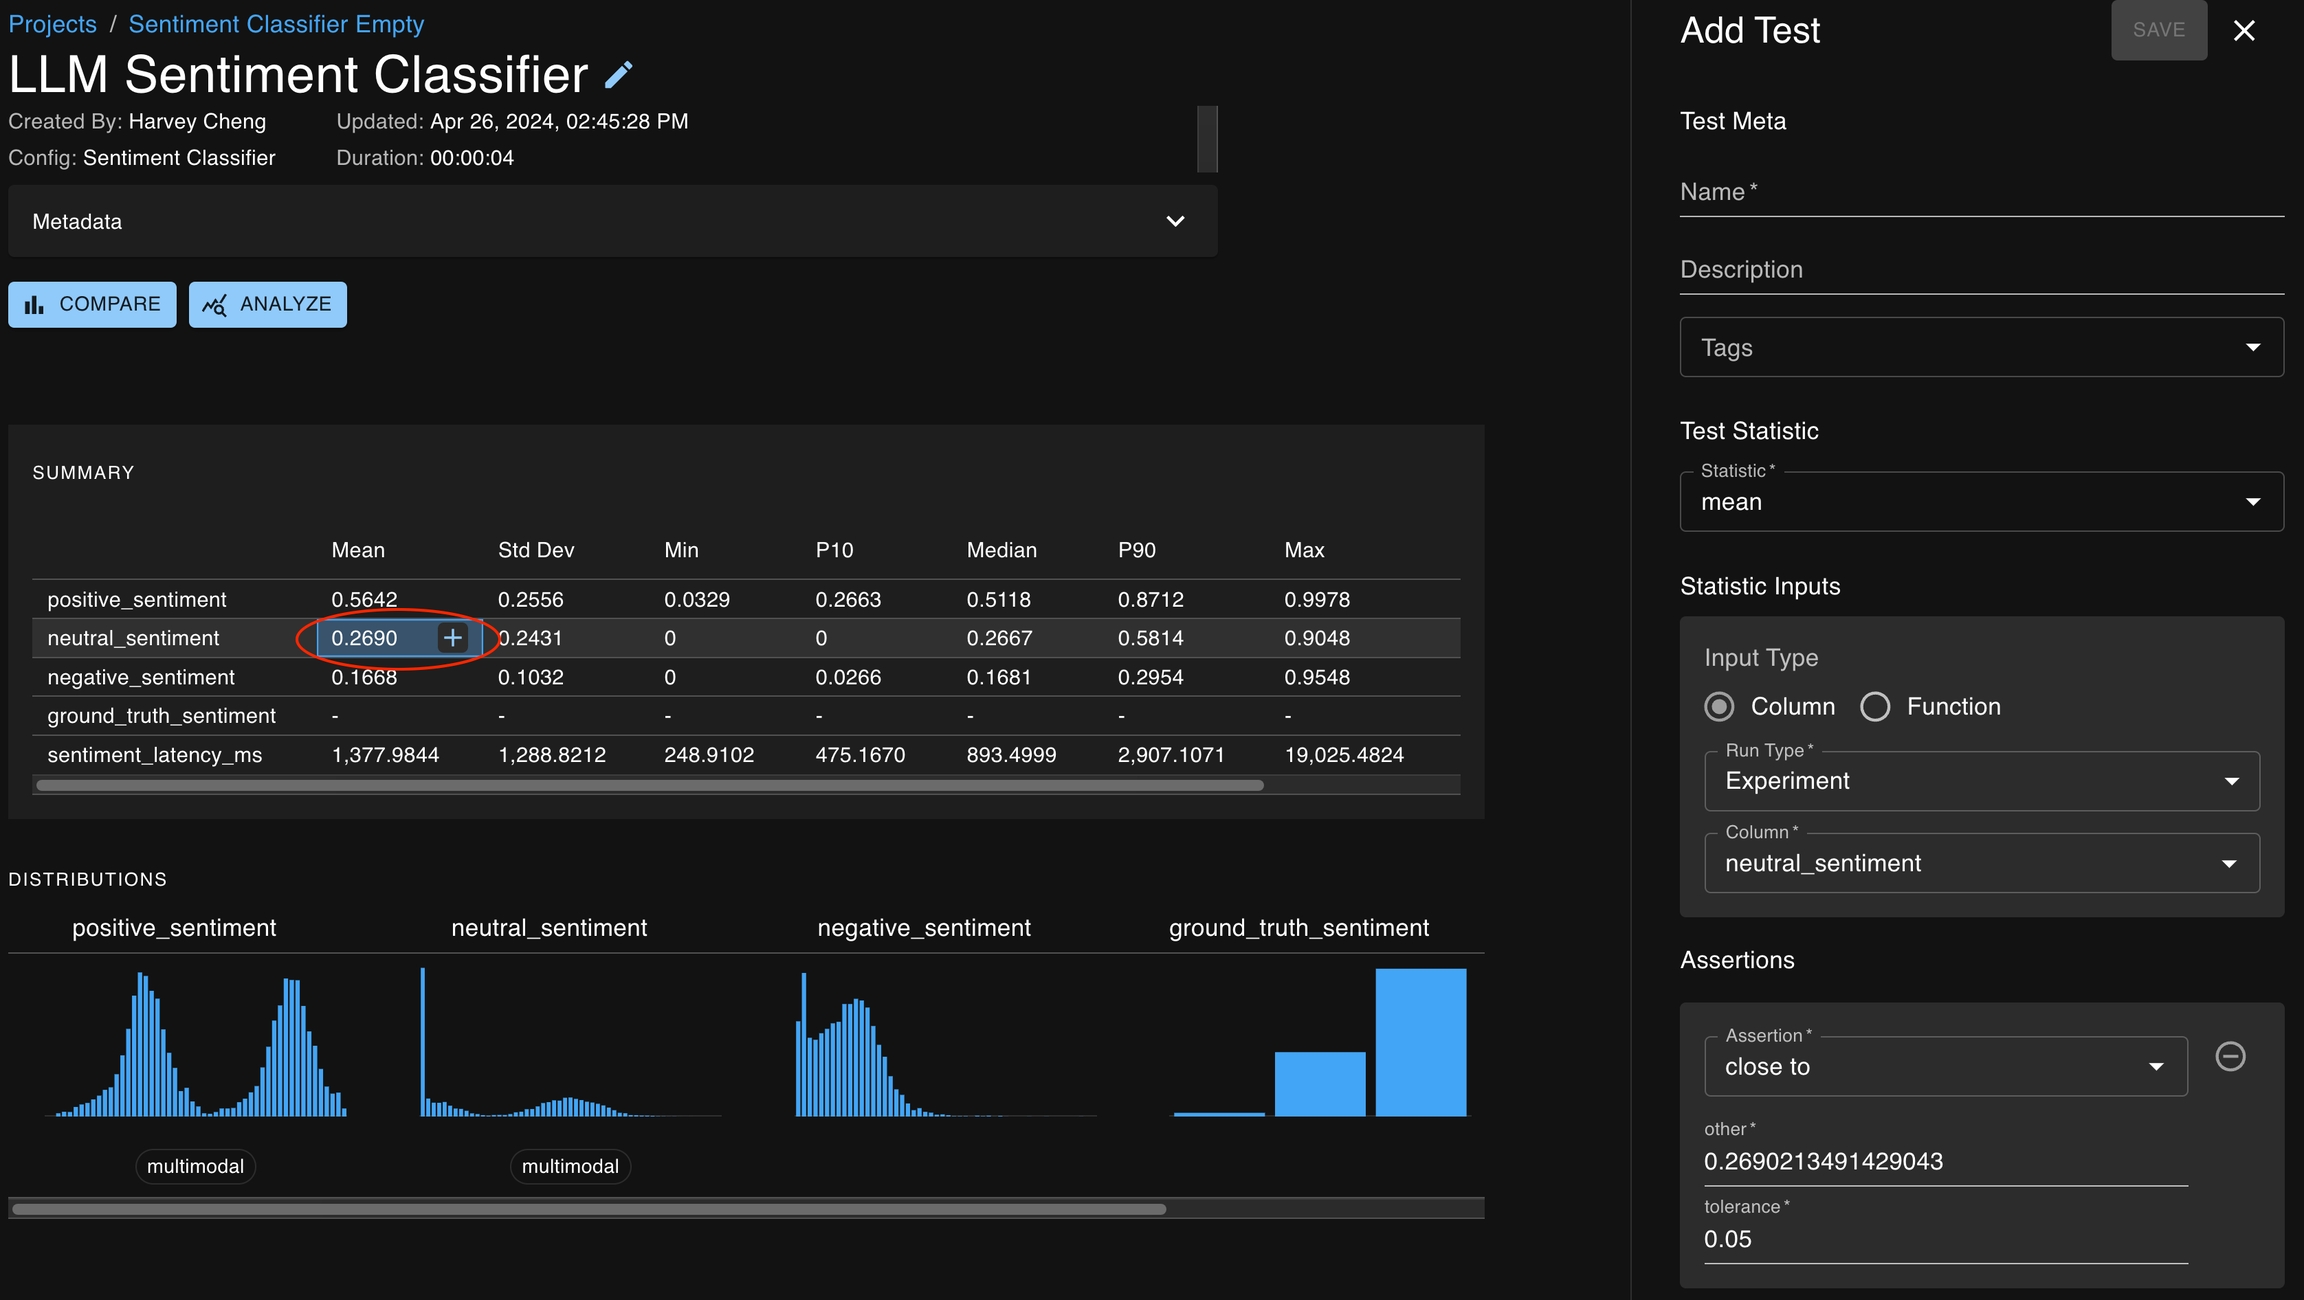
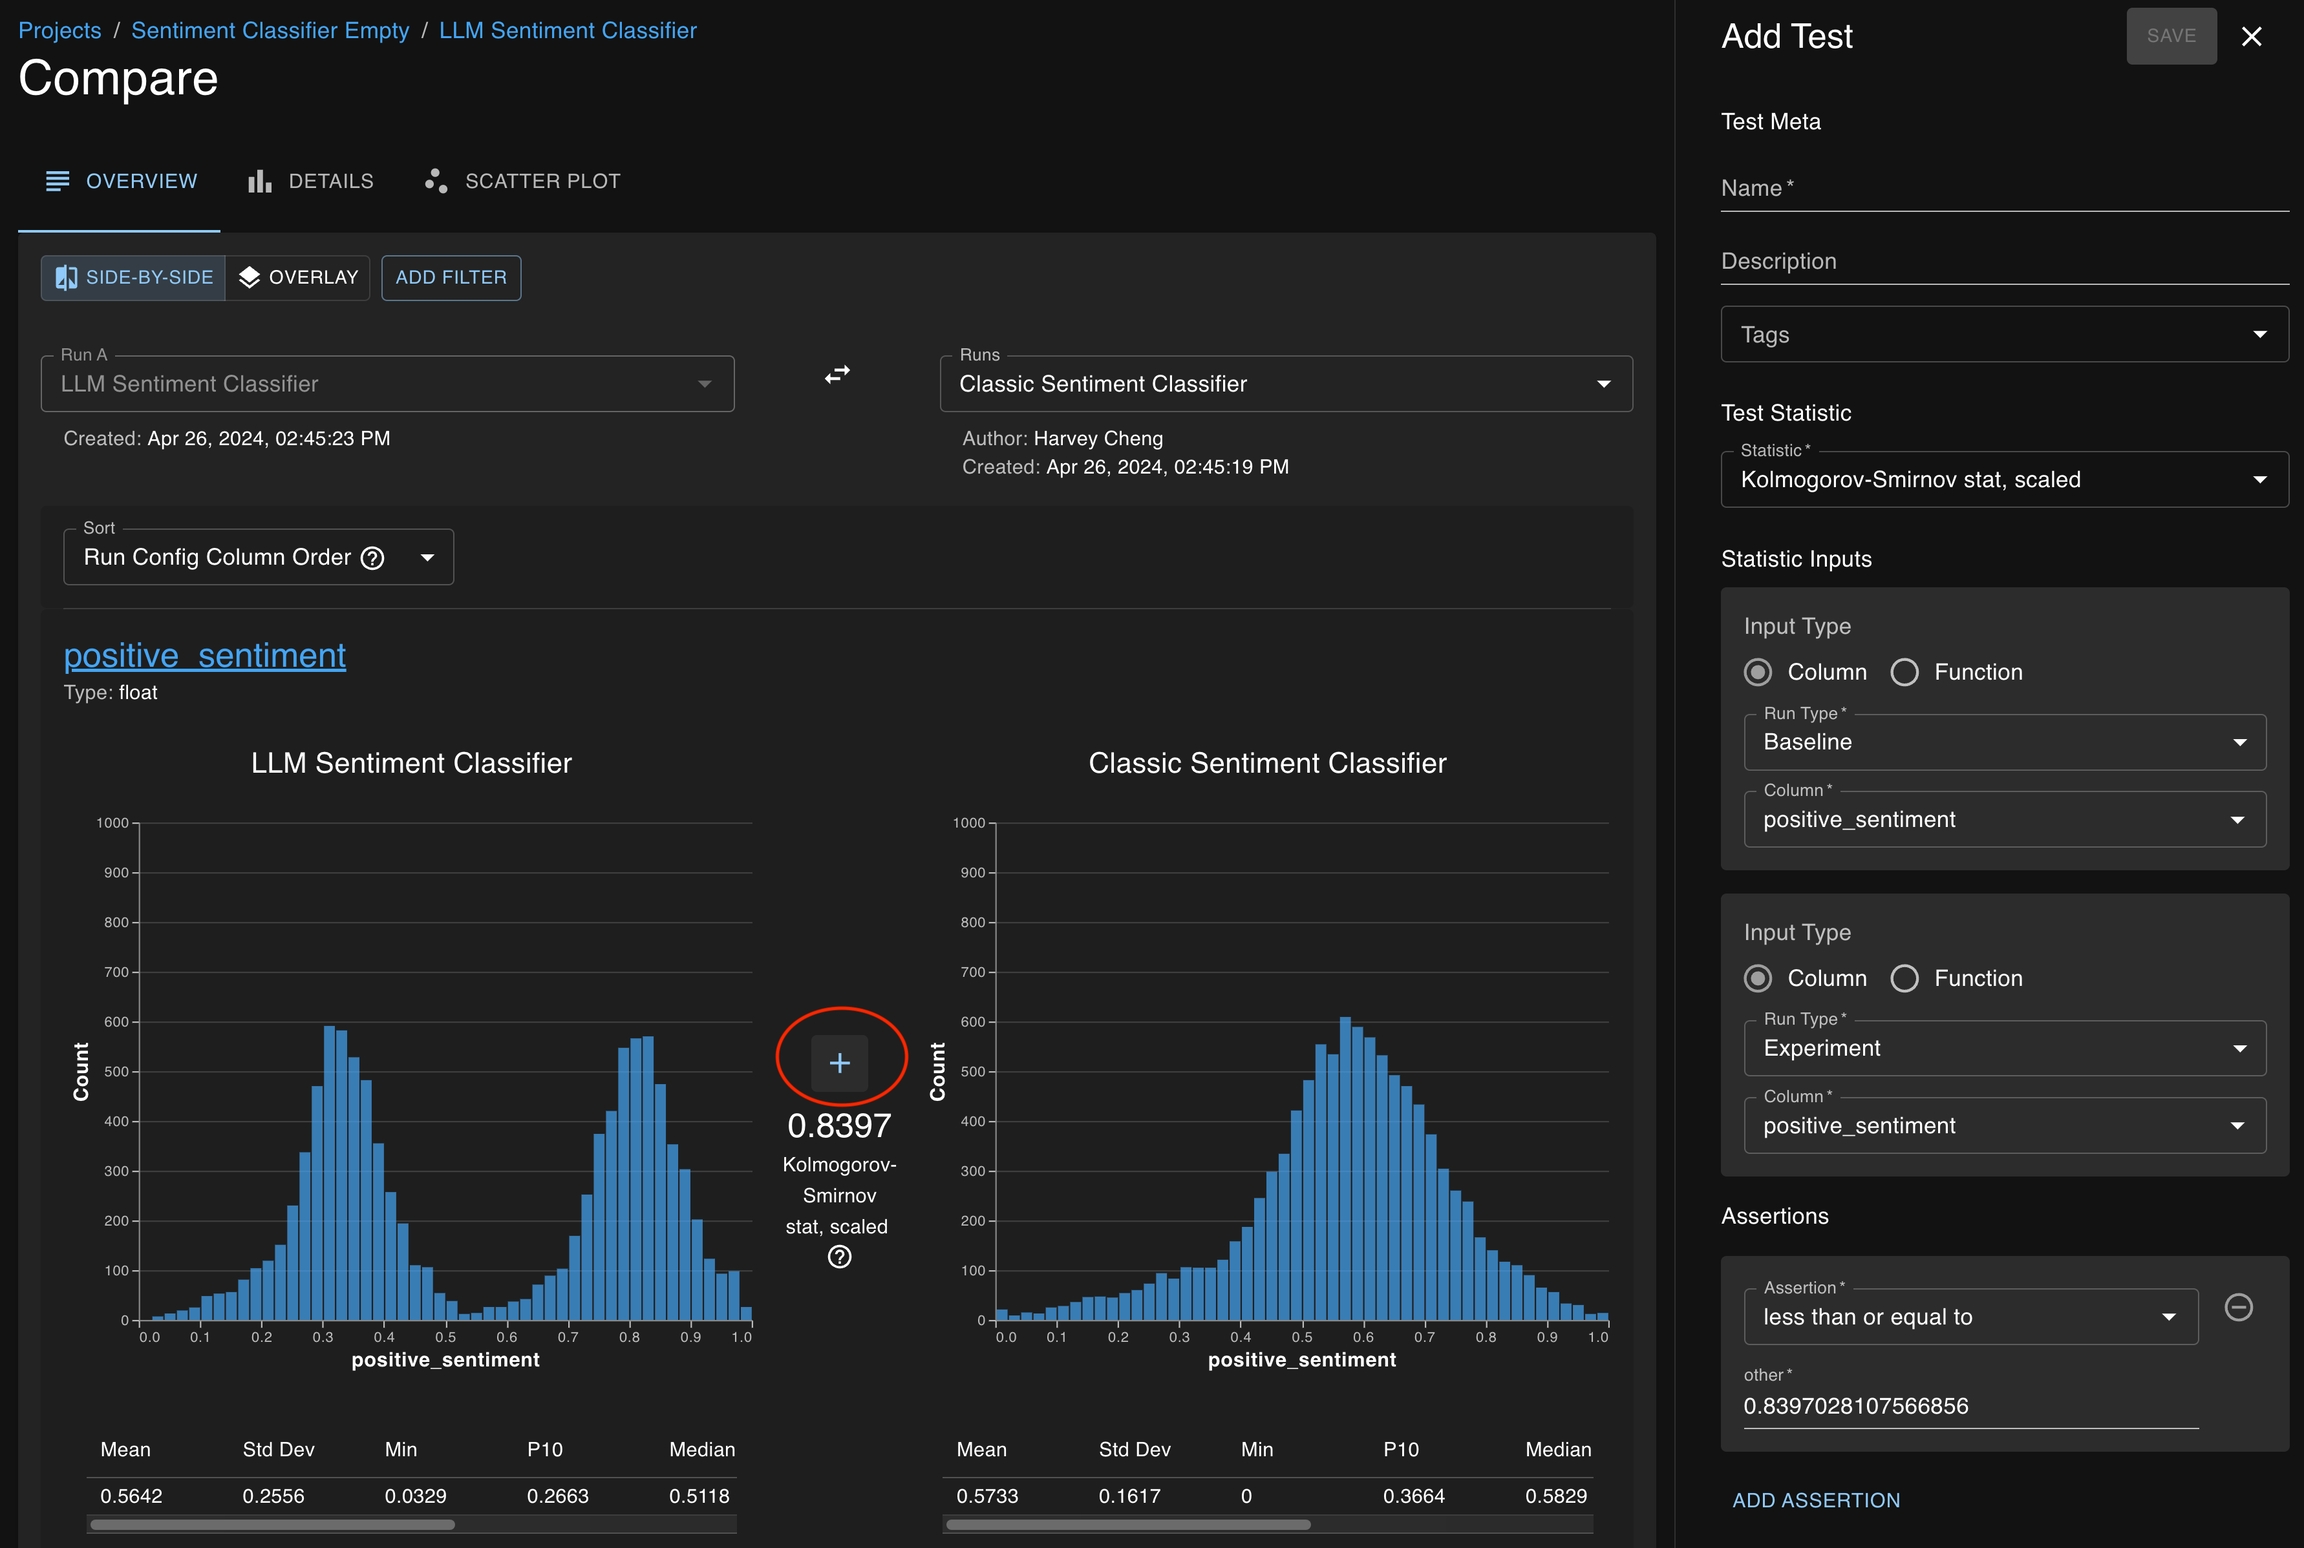
You can also create tests by clicking on the + icon button which appears in several places :
Cells in the summary statistics tables (found on the Run Detail page, Compare pages)
Mini charts (clicking on the title and the column feature button, found on Run Detail page)
Above statistics found on Compare pages
At each of these locations, a test creation drawer will open on the right side of the page with several of the fields pre-populated based on the context of the button.
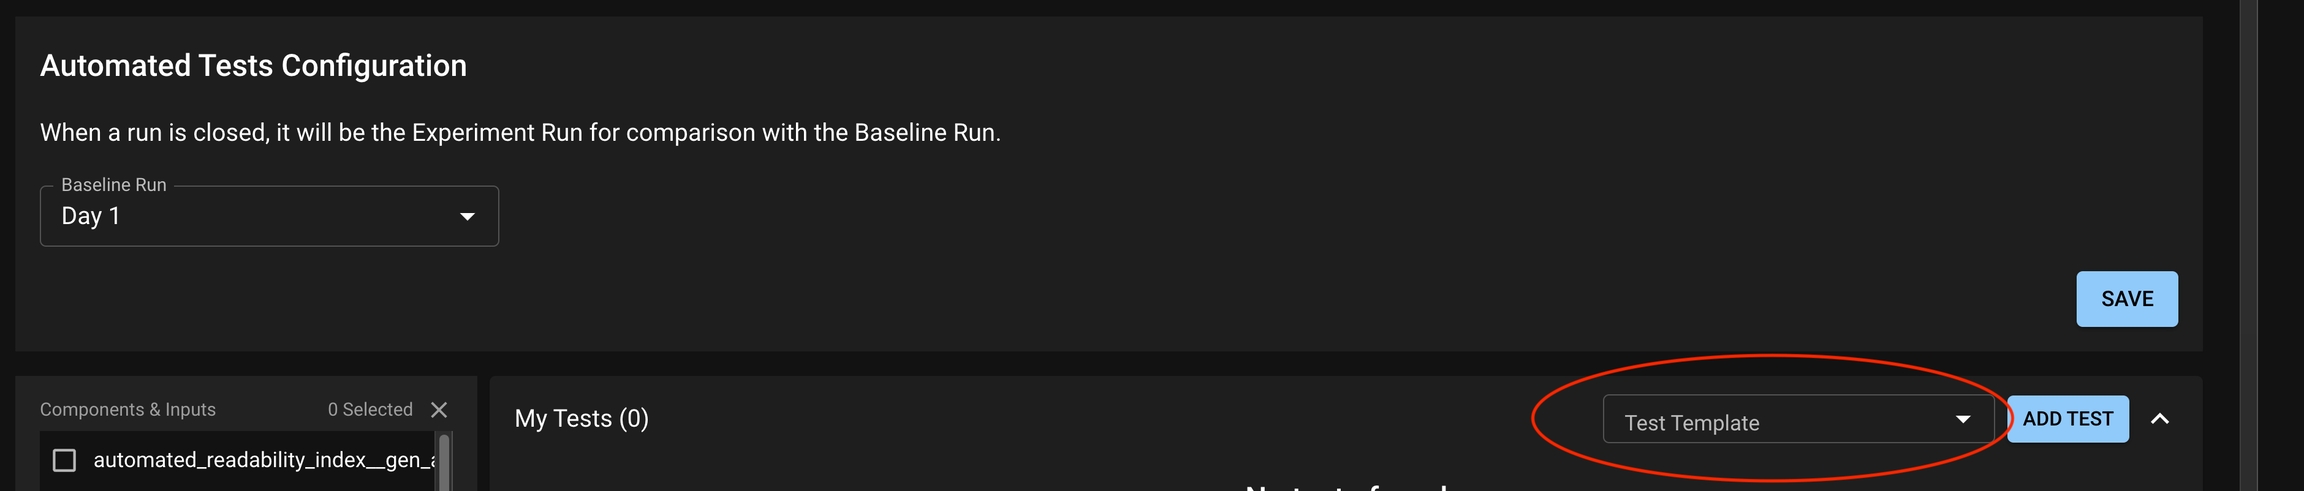
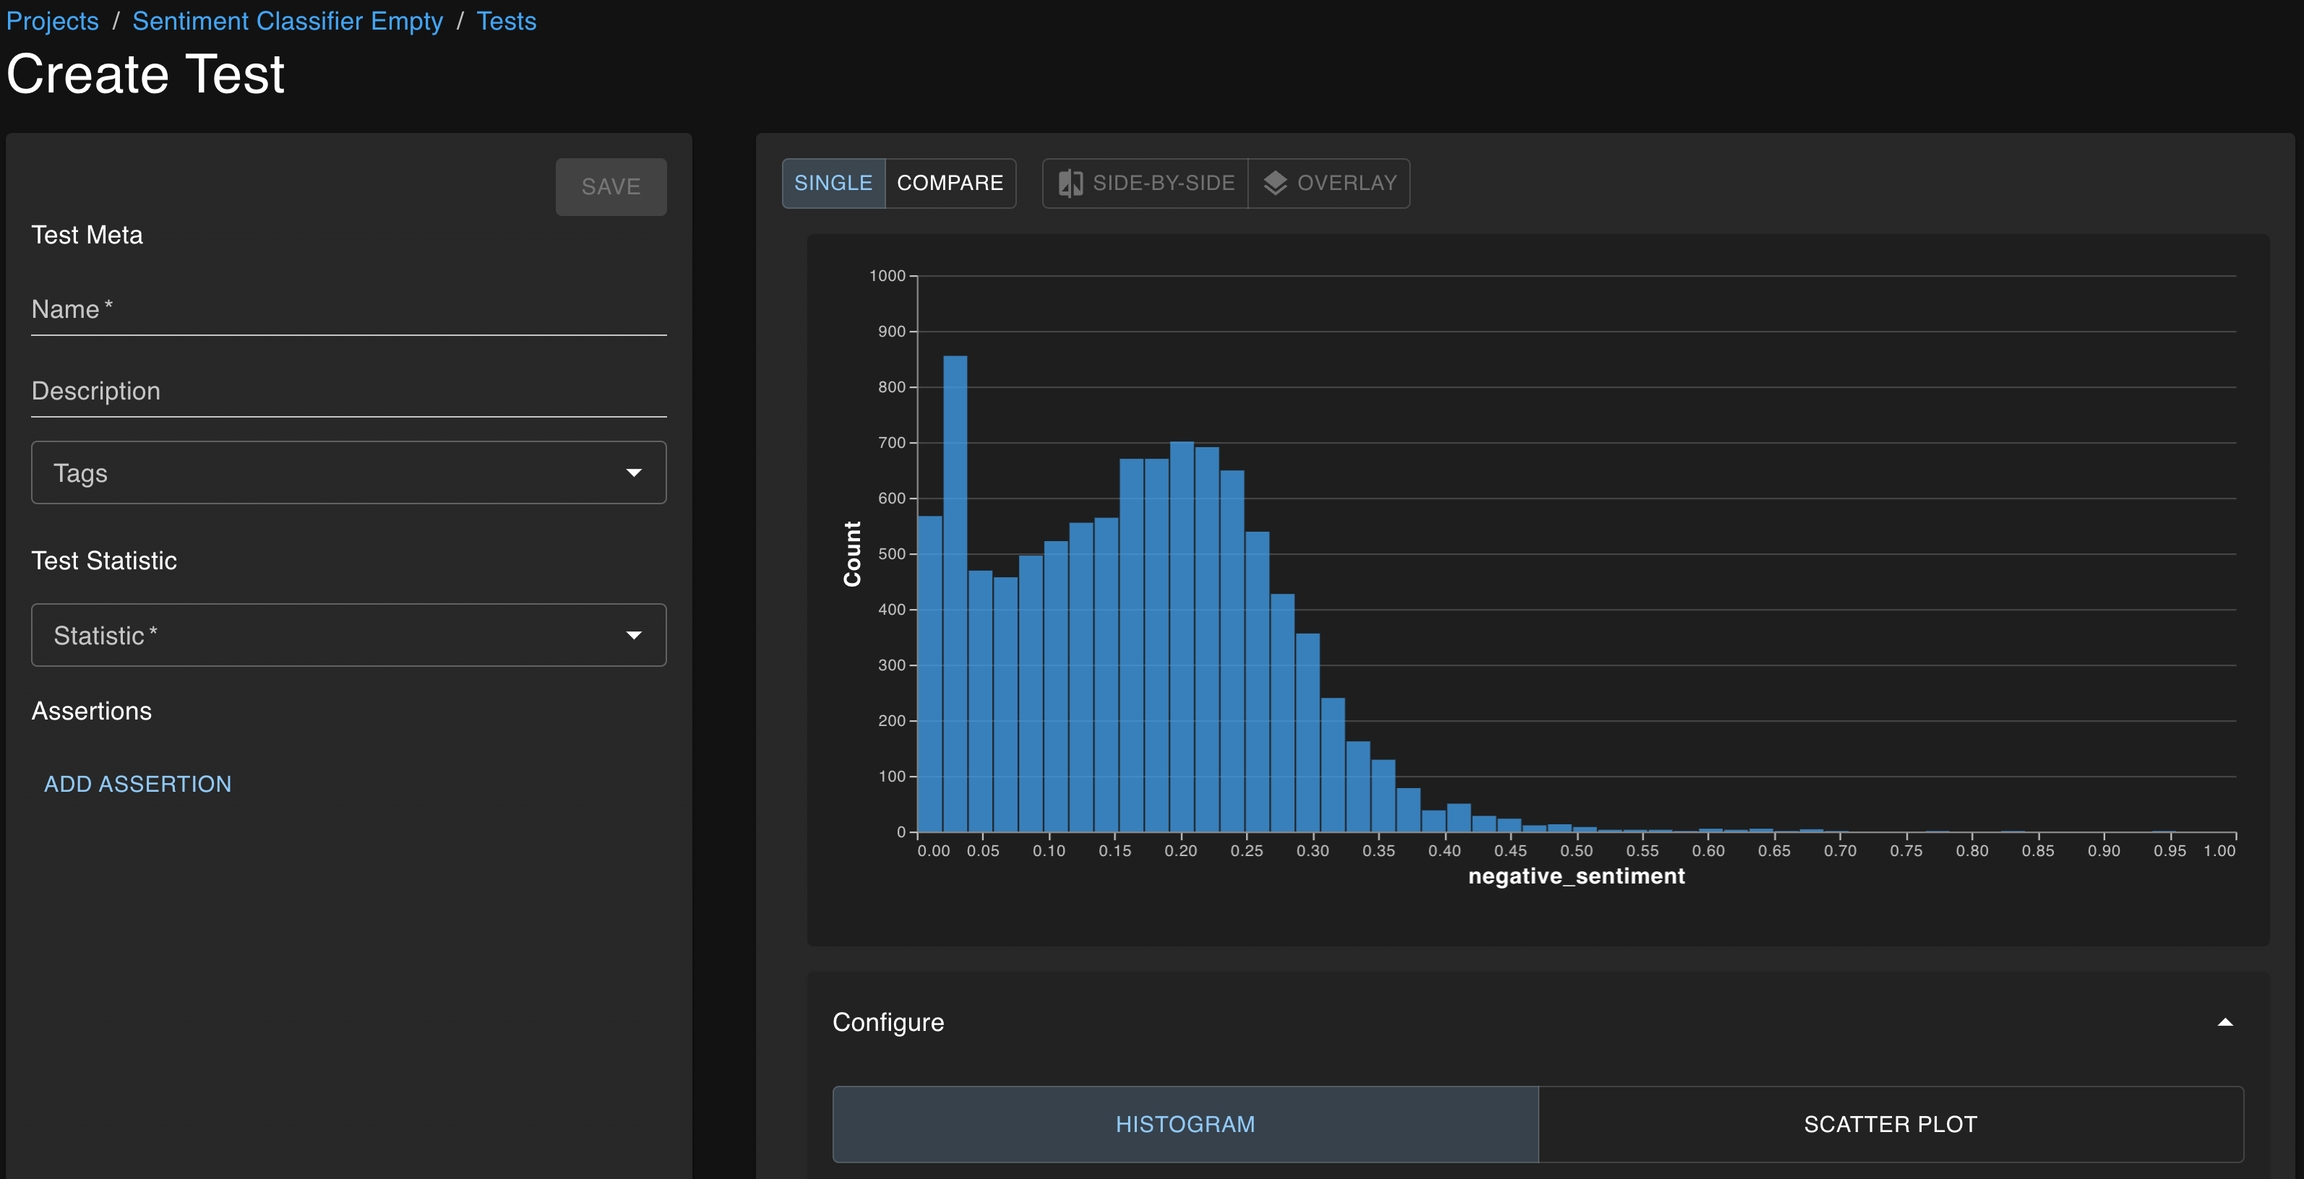
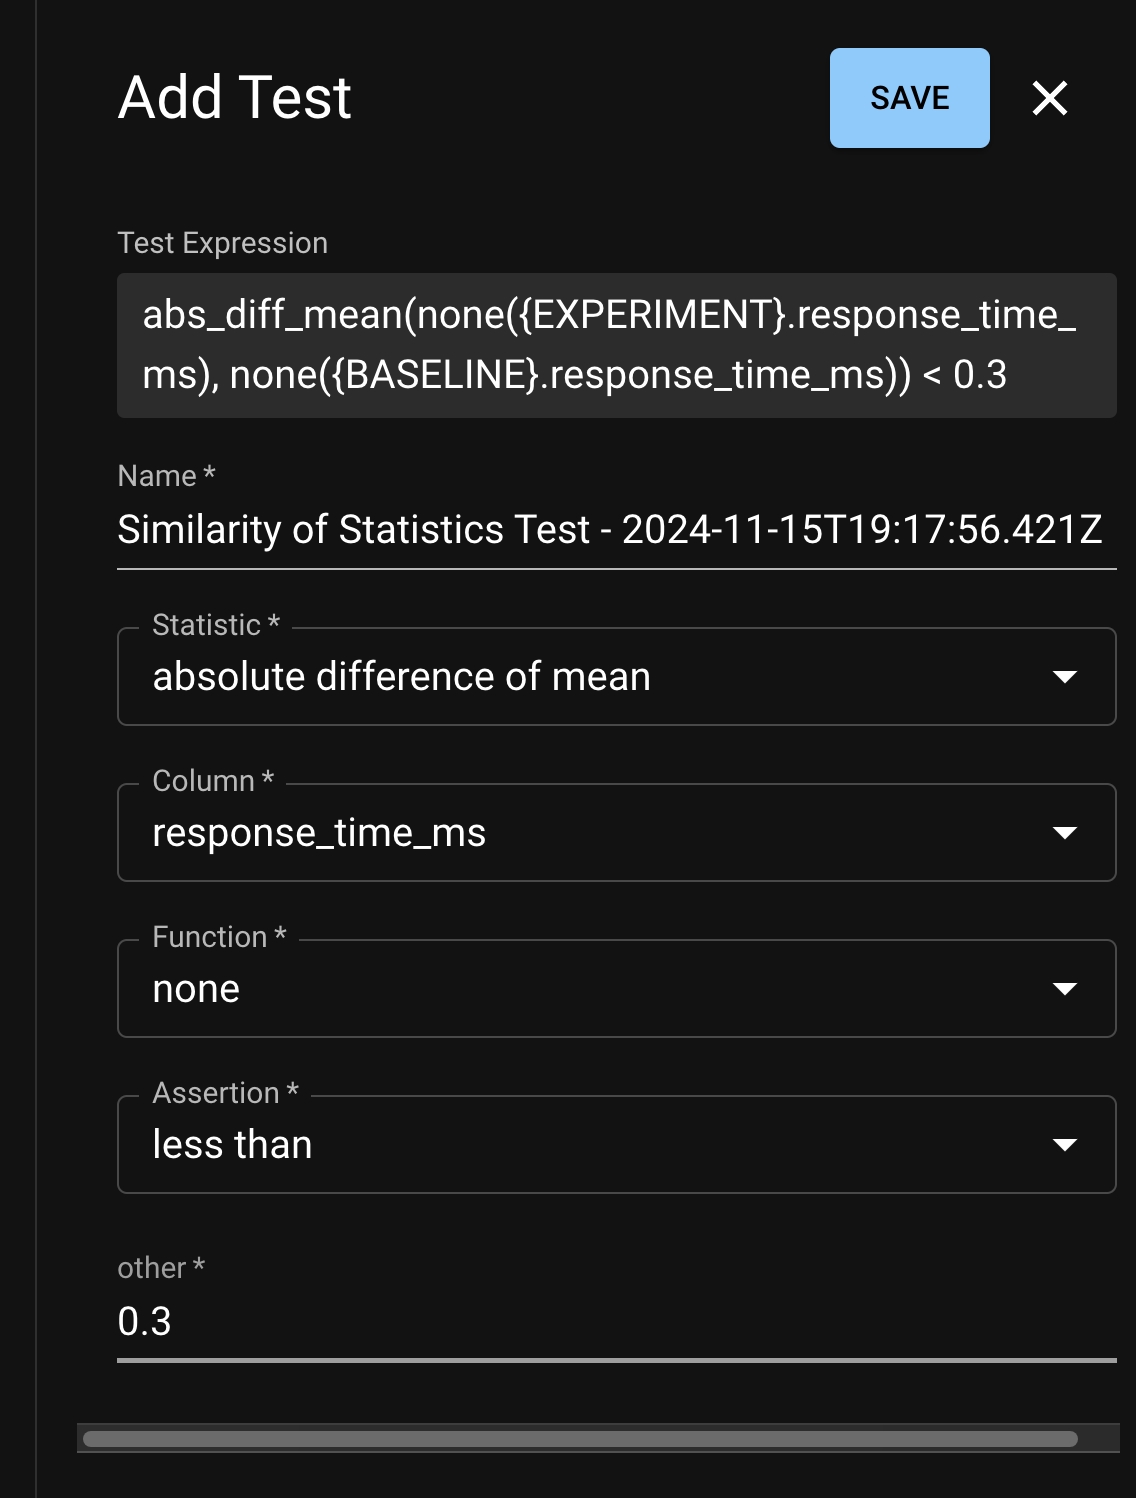
The base location at which a test can be created is the Test Configuration page, which is accessible from the Project Detail page.
From here, you can click Add Test to open the test creation page, which will enable you to define your test through the dropdown menu on the left side of the window.
The graphs available on the right side of the window can help guide test development as you choose the statistics you want to study and the thresholds which define acceptable behavior.
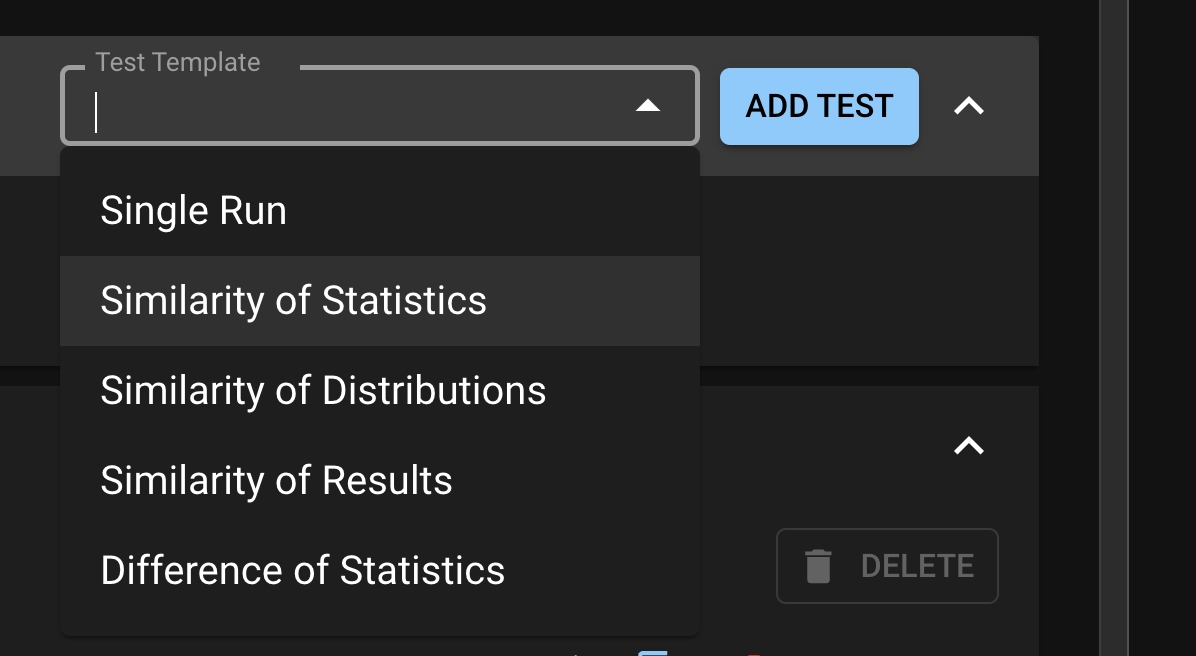
Test templates are macros for basic test patterns recommended by Distributional. It allows the user to quickly create tests from a builder in the UI. Distributional provides five classes of Test Templates.
: These are parametric statistics of a column.
: These test if the absolute difference of a statistic of a column between two runs is less than a threshold.
: These test if the column from two different runs are similarly distributed is using a nonparametric statistic.
: These are tests on the row-wise absolute difference of result
: These tests the signed difference of a statistic of a column between two runs
From the Test Configuration page, click the Test Template dropdown under My Tests.
Select from one of the five options and click ADD TEST. A Test Creation drawer will appear and the user can edit the statistic, column, and assertion that they desire. Note that each Test Template has a limited set of statistics that it supports.
Assertions are the second half of test creation — defining what statistical values seem appropriate or aberrant
A test consists of statistical quantities that define the behavior of one or more runs and an associated threshold which determines whether those statistics define acceptable behavior. Essentially, a test passes or fails based on whether the quantities satisfy the thresholds. Common assertions include:
equal_to – Used most often to confirm that two distributions are exactly identical
close_to – Can be used to confirm that two quantities are near each other, e.g., that the 90th
less_than – Can be used to confirm that nonparametric statistics are small enough to indicate that two distributions are suitably similar
A full list of assertions can be found at the test creation page.
Choosing a threshold can be simple, or it can be complicated. When the statistic under analysis has easily interpreted values, these thresholds can emerge naturally.
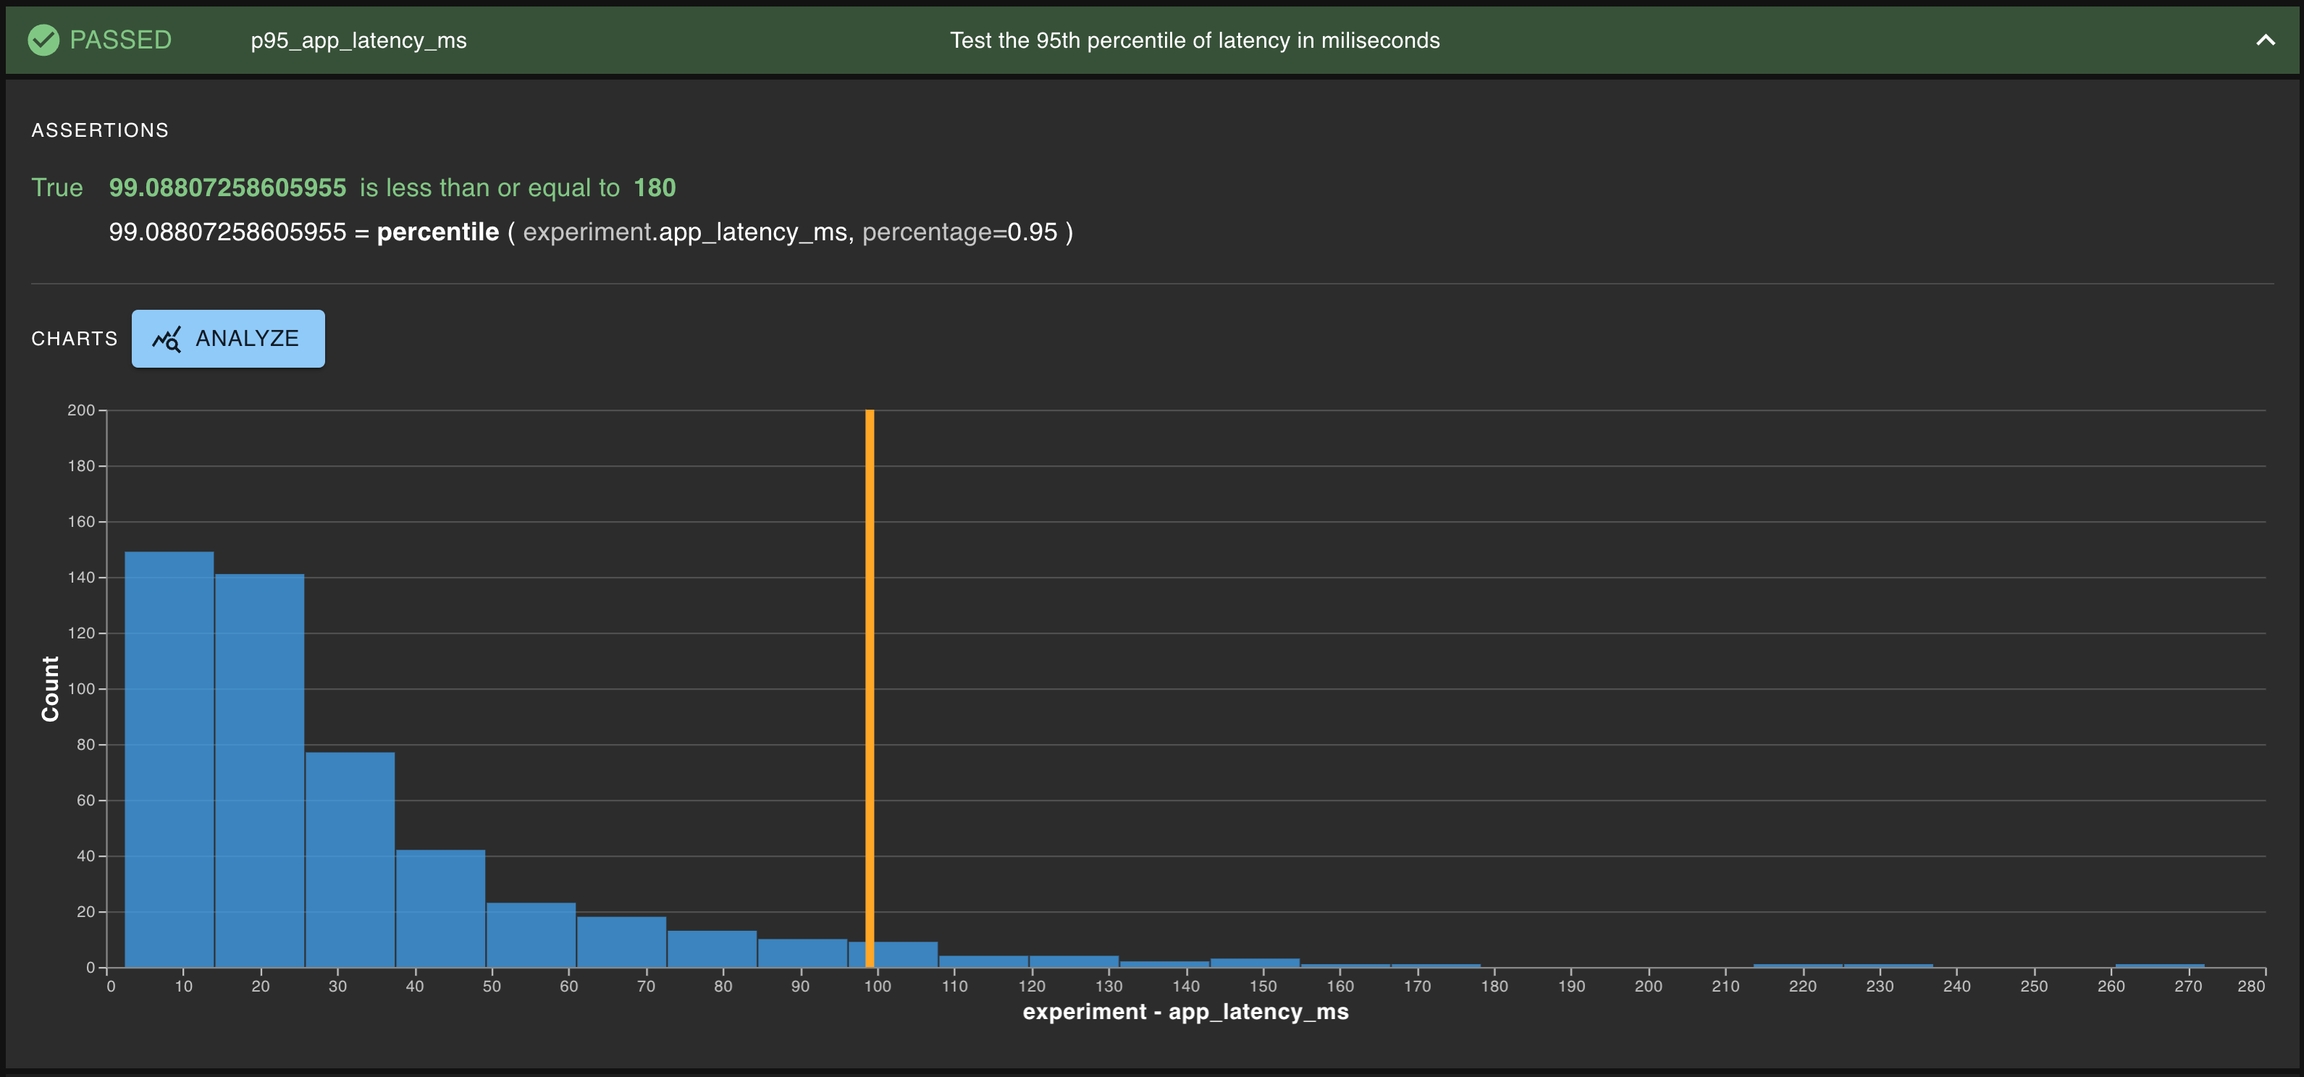
Example: The 90th percentile of the app latency must be less than 123ms.
Here, the statistic is the percentile(EXPERIMENT.latency, 90), and the threshold is “less than 123”.
Example: No result should have more than a 0.098 difference in probability of fraud prediction against the baseline.
Here, the statistic is max(matched_abs_diff(EXPERIMENT.prob_fraud, BASELINE.prob_fraud)) and the threshold is “less than 0.098”.
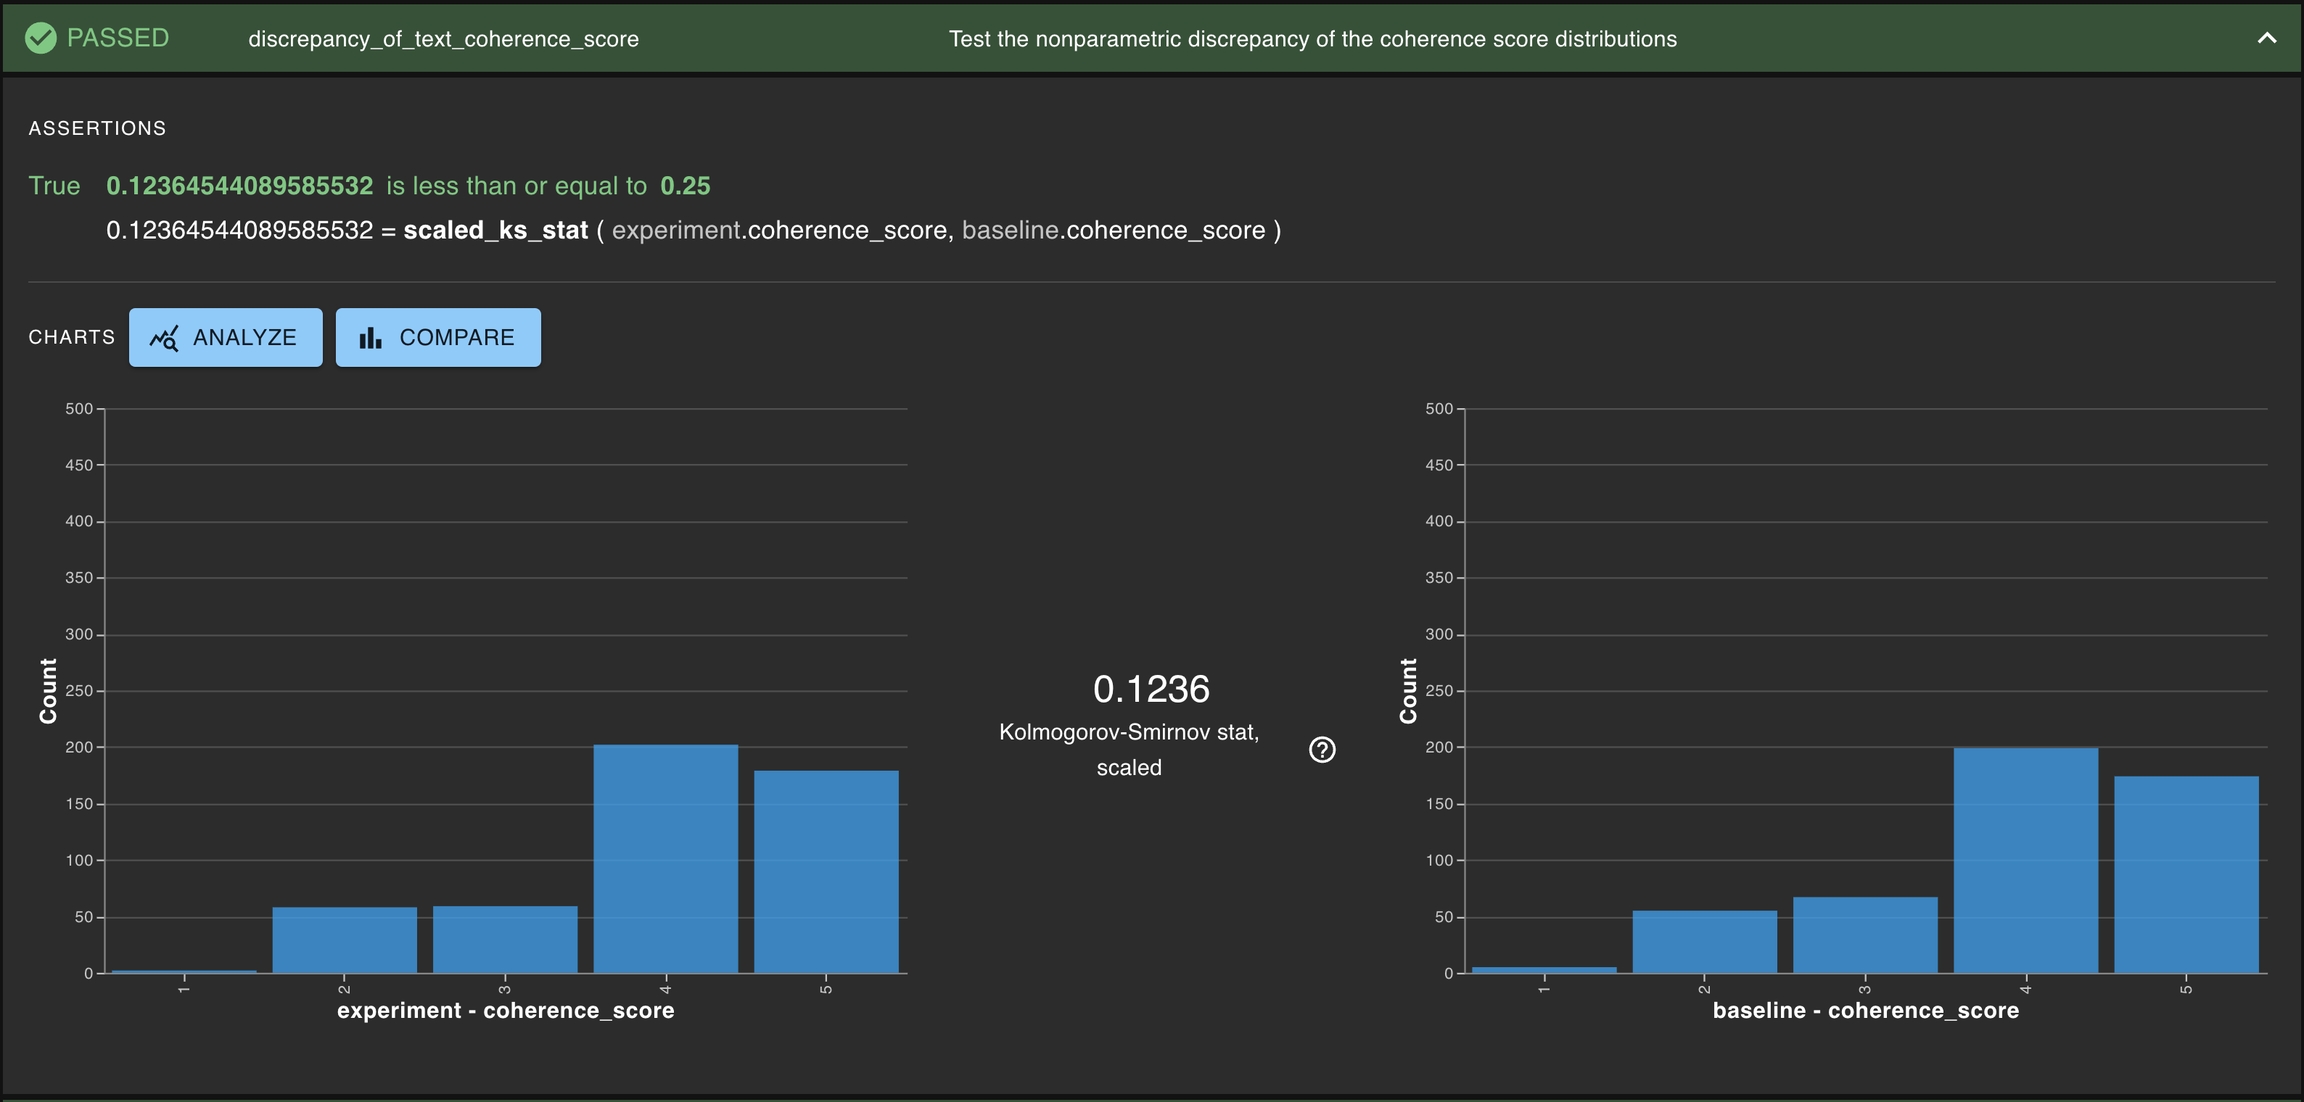
In situations where nonparametric quantities, like the scaled Kolmogorov-Smirnov statistic, are used to state whether two distributions are sufficiently similar, it can be difficult to identify the appropriate threshold. This is something that may require some trial and error, as well as some guidance from your dedicated Applied Customer Engineer. Please reach out as you would like our support developing thresholds for these statistics.
Additionally, we are hard at work developing new strategies for adaptively learning thresholds for our customers based on their preferences. If you would like to be a part of this development and beta testing process, please inform your Applied Customer Engineer.
Production testing focuses on the need to regularly check in on the health of an app as it has behaved in the real world. Users want to detect changes in either their AI app behavior or the environment that it is operated in. At Distributional, we help users to confidently answer these questions.
In the case of production testing, Distributional recommends testing the similarity of distributions of the data related to the AI app between the current Run and a baseline Run. Users can start with the auto-test generation feature to let Distributional generate the necessary production tests for a given Run.
Like in traditional software testing, it is paramount to come up with a testing strategy that has both breadth and depth. Such a set of tests gives confidence that the AI-powered app is behaving as expected, or it alerts you that the opposite may be true.
To build out a comprehensive testing strategy it is important to come up with a series of assertions and statistics on which to create tests. This section explains several goals when testing and how to create tests to assert desired behavior.
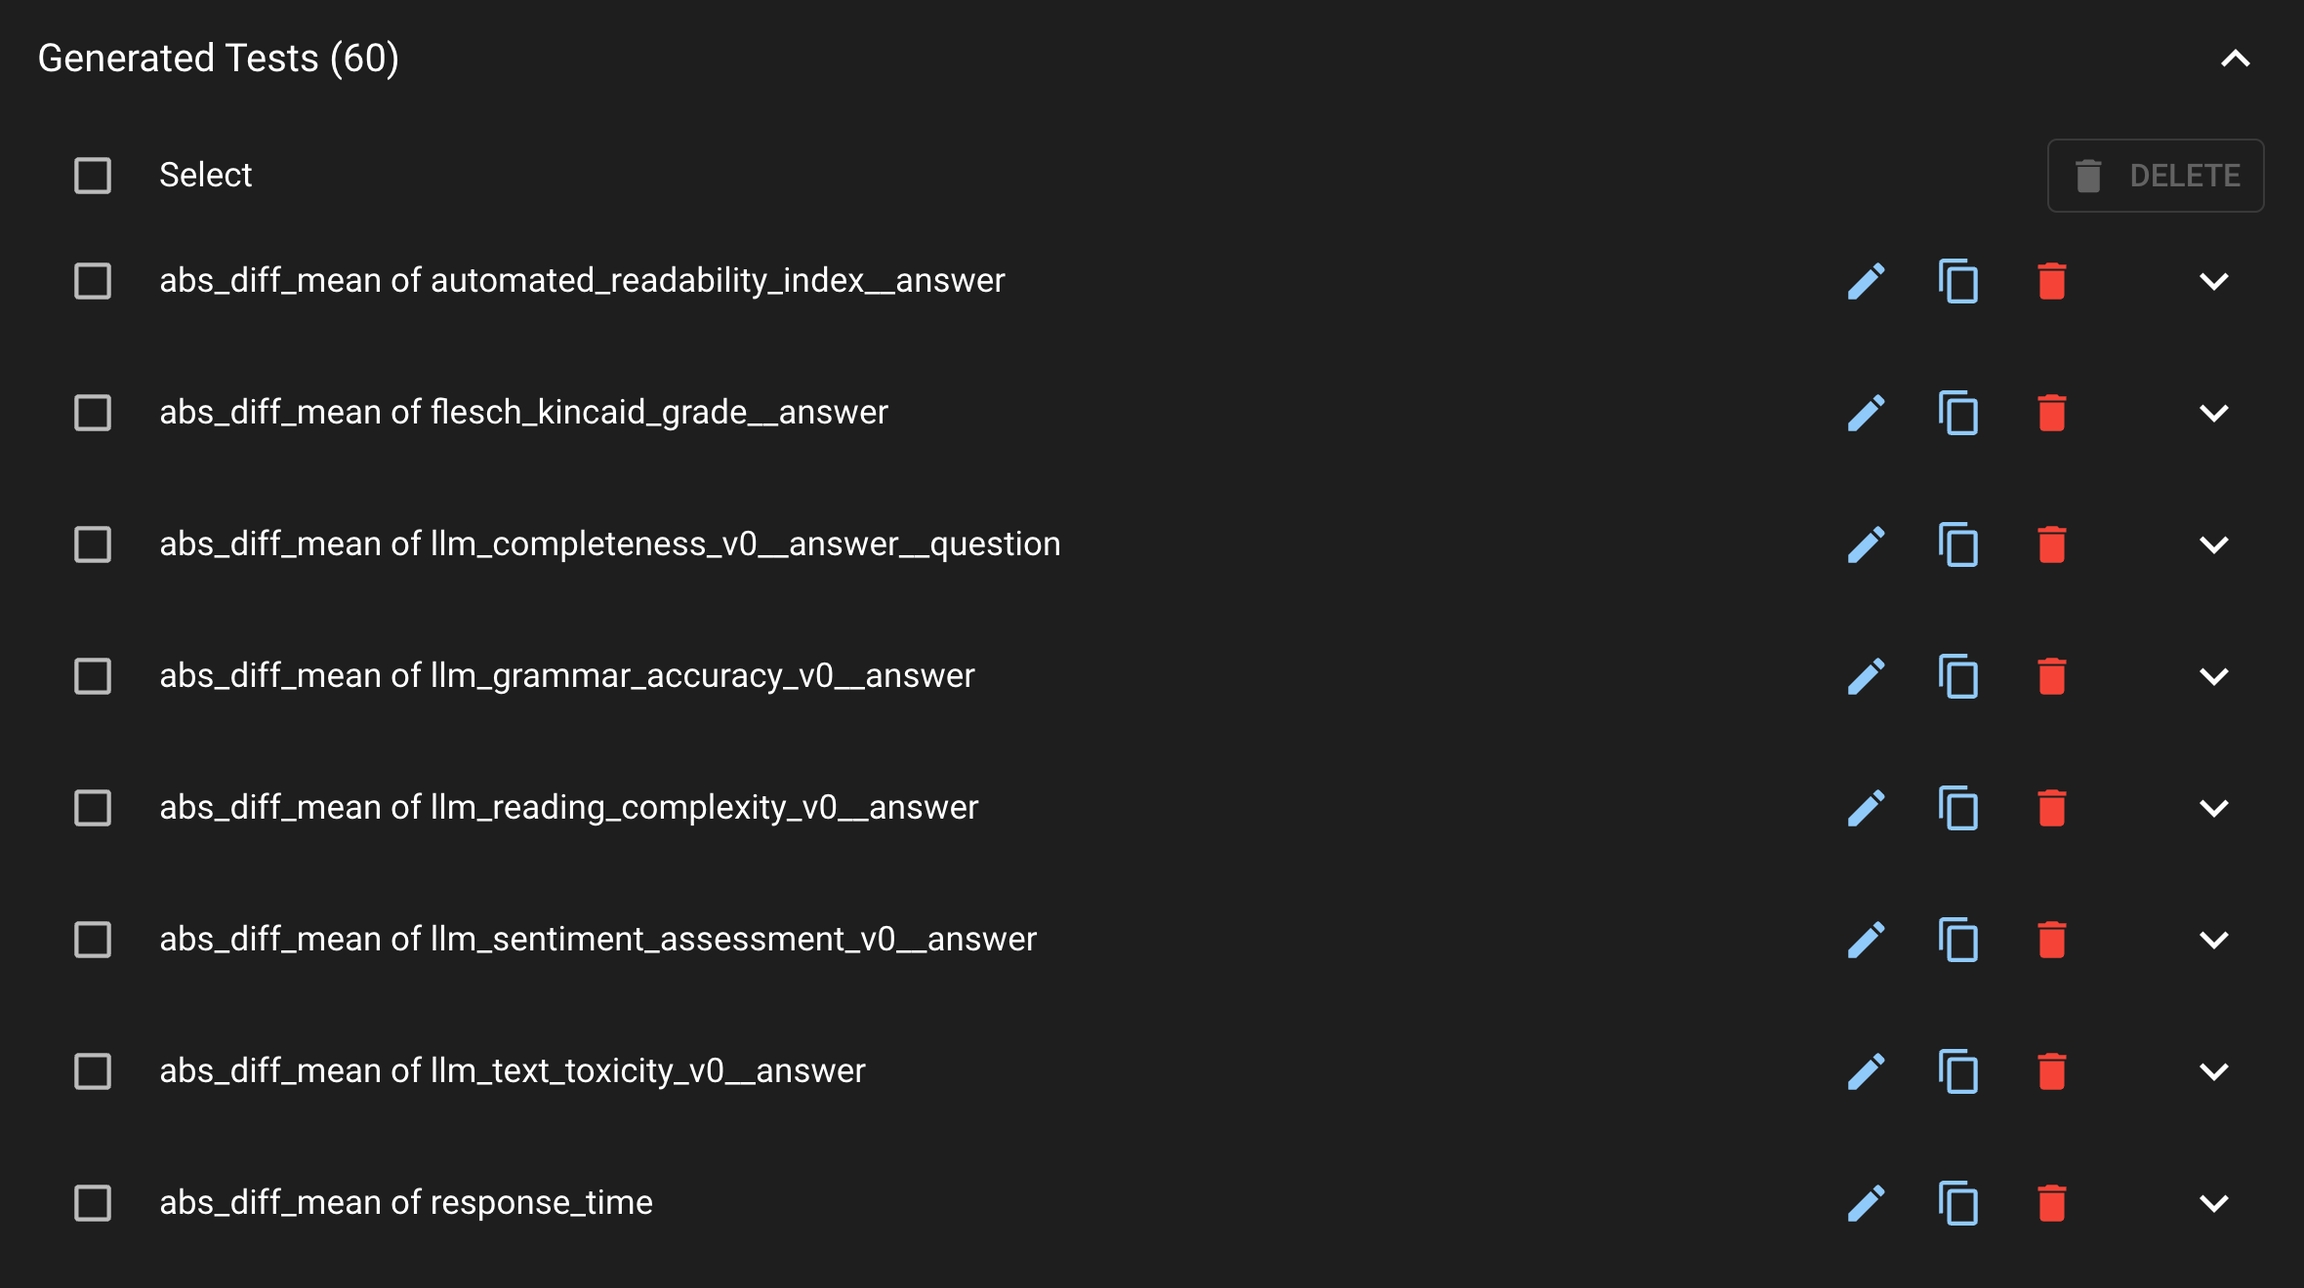
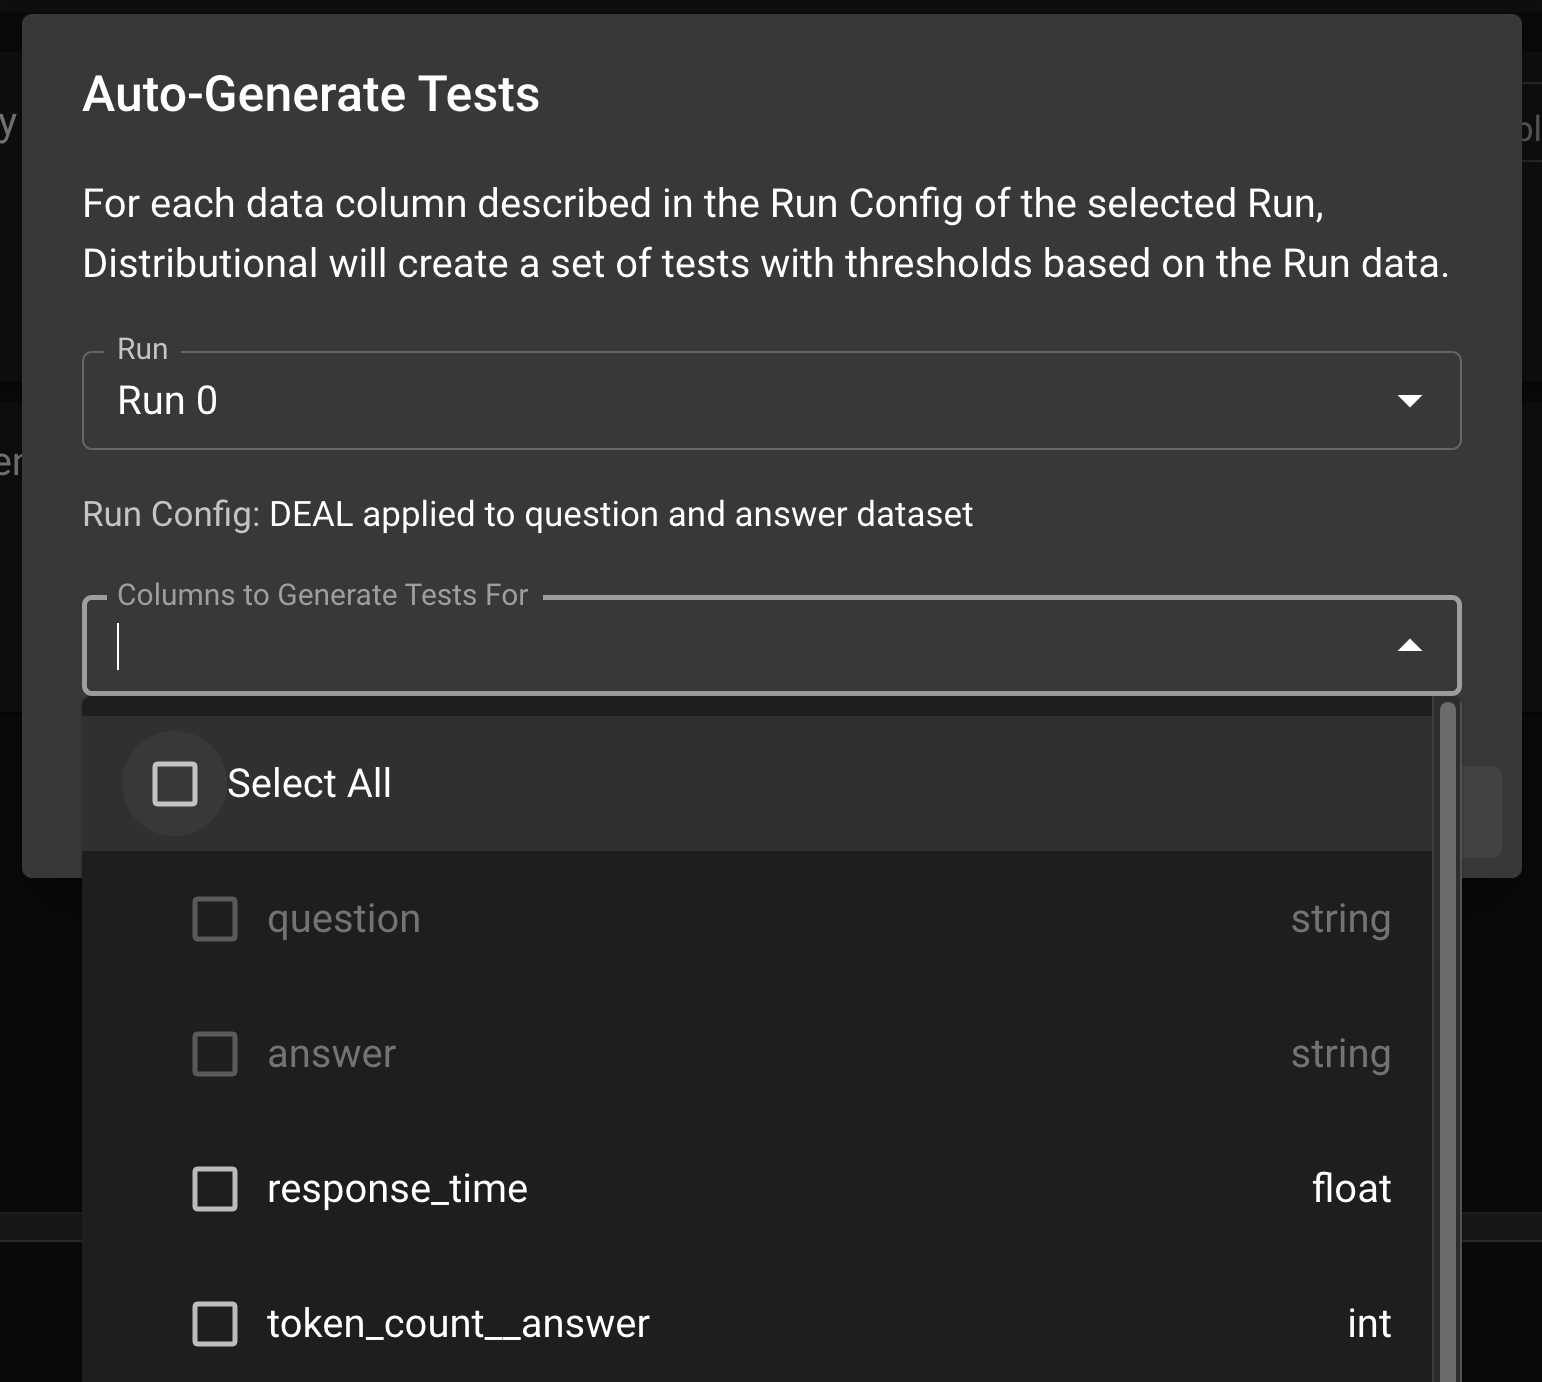
In order to facilitate production testing, Distributional can automatically generate a suite of Tests based on the user’s uploaded data. Distributional studies the Run results data and create the appropriate thresholds for the Tests.
In the Test Config page, click the AUTO-GENERATE TESTS button; this will prompt a modal where the user can select the Run which the tests will be based on. Click Select All to generate tests for all columns or optionally sub-select the columns to generate tests. Click GENERATE TESTS to generate the production tests.
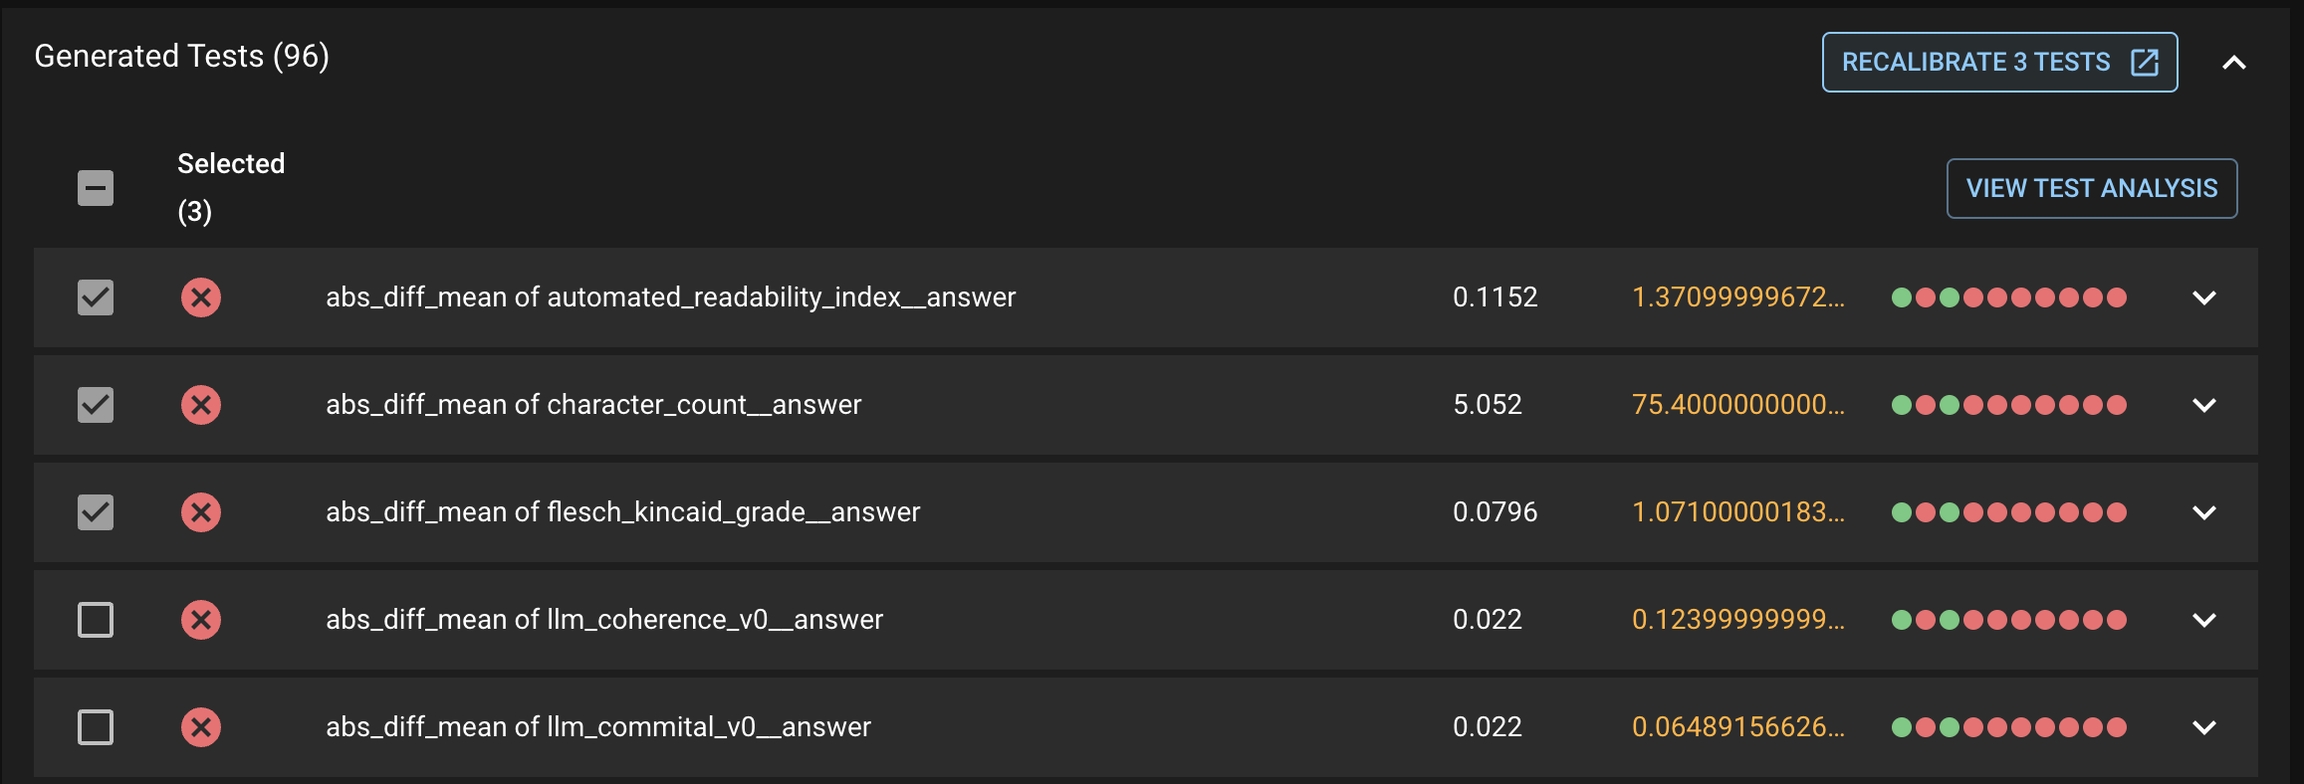
Once the Tests are generated, you can view them under the Generated Tests section.
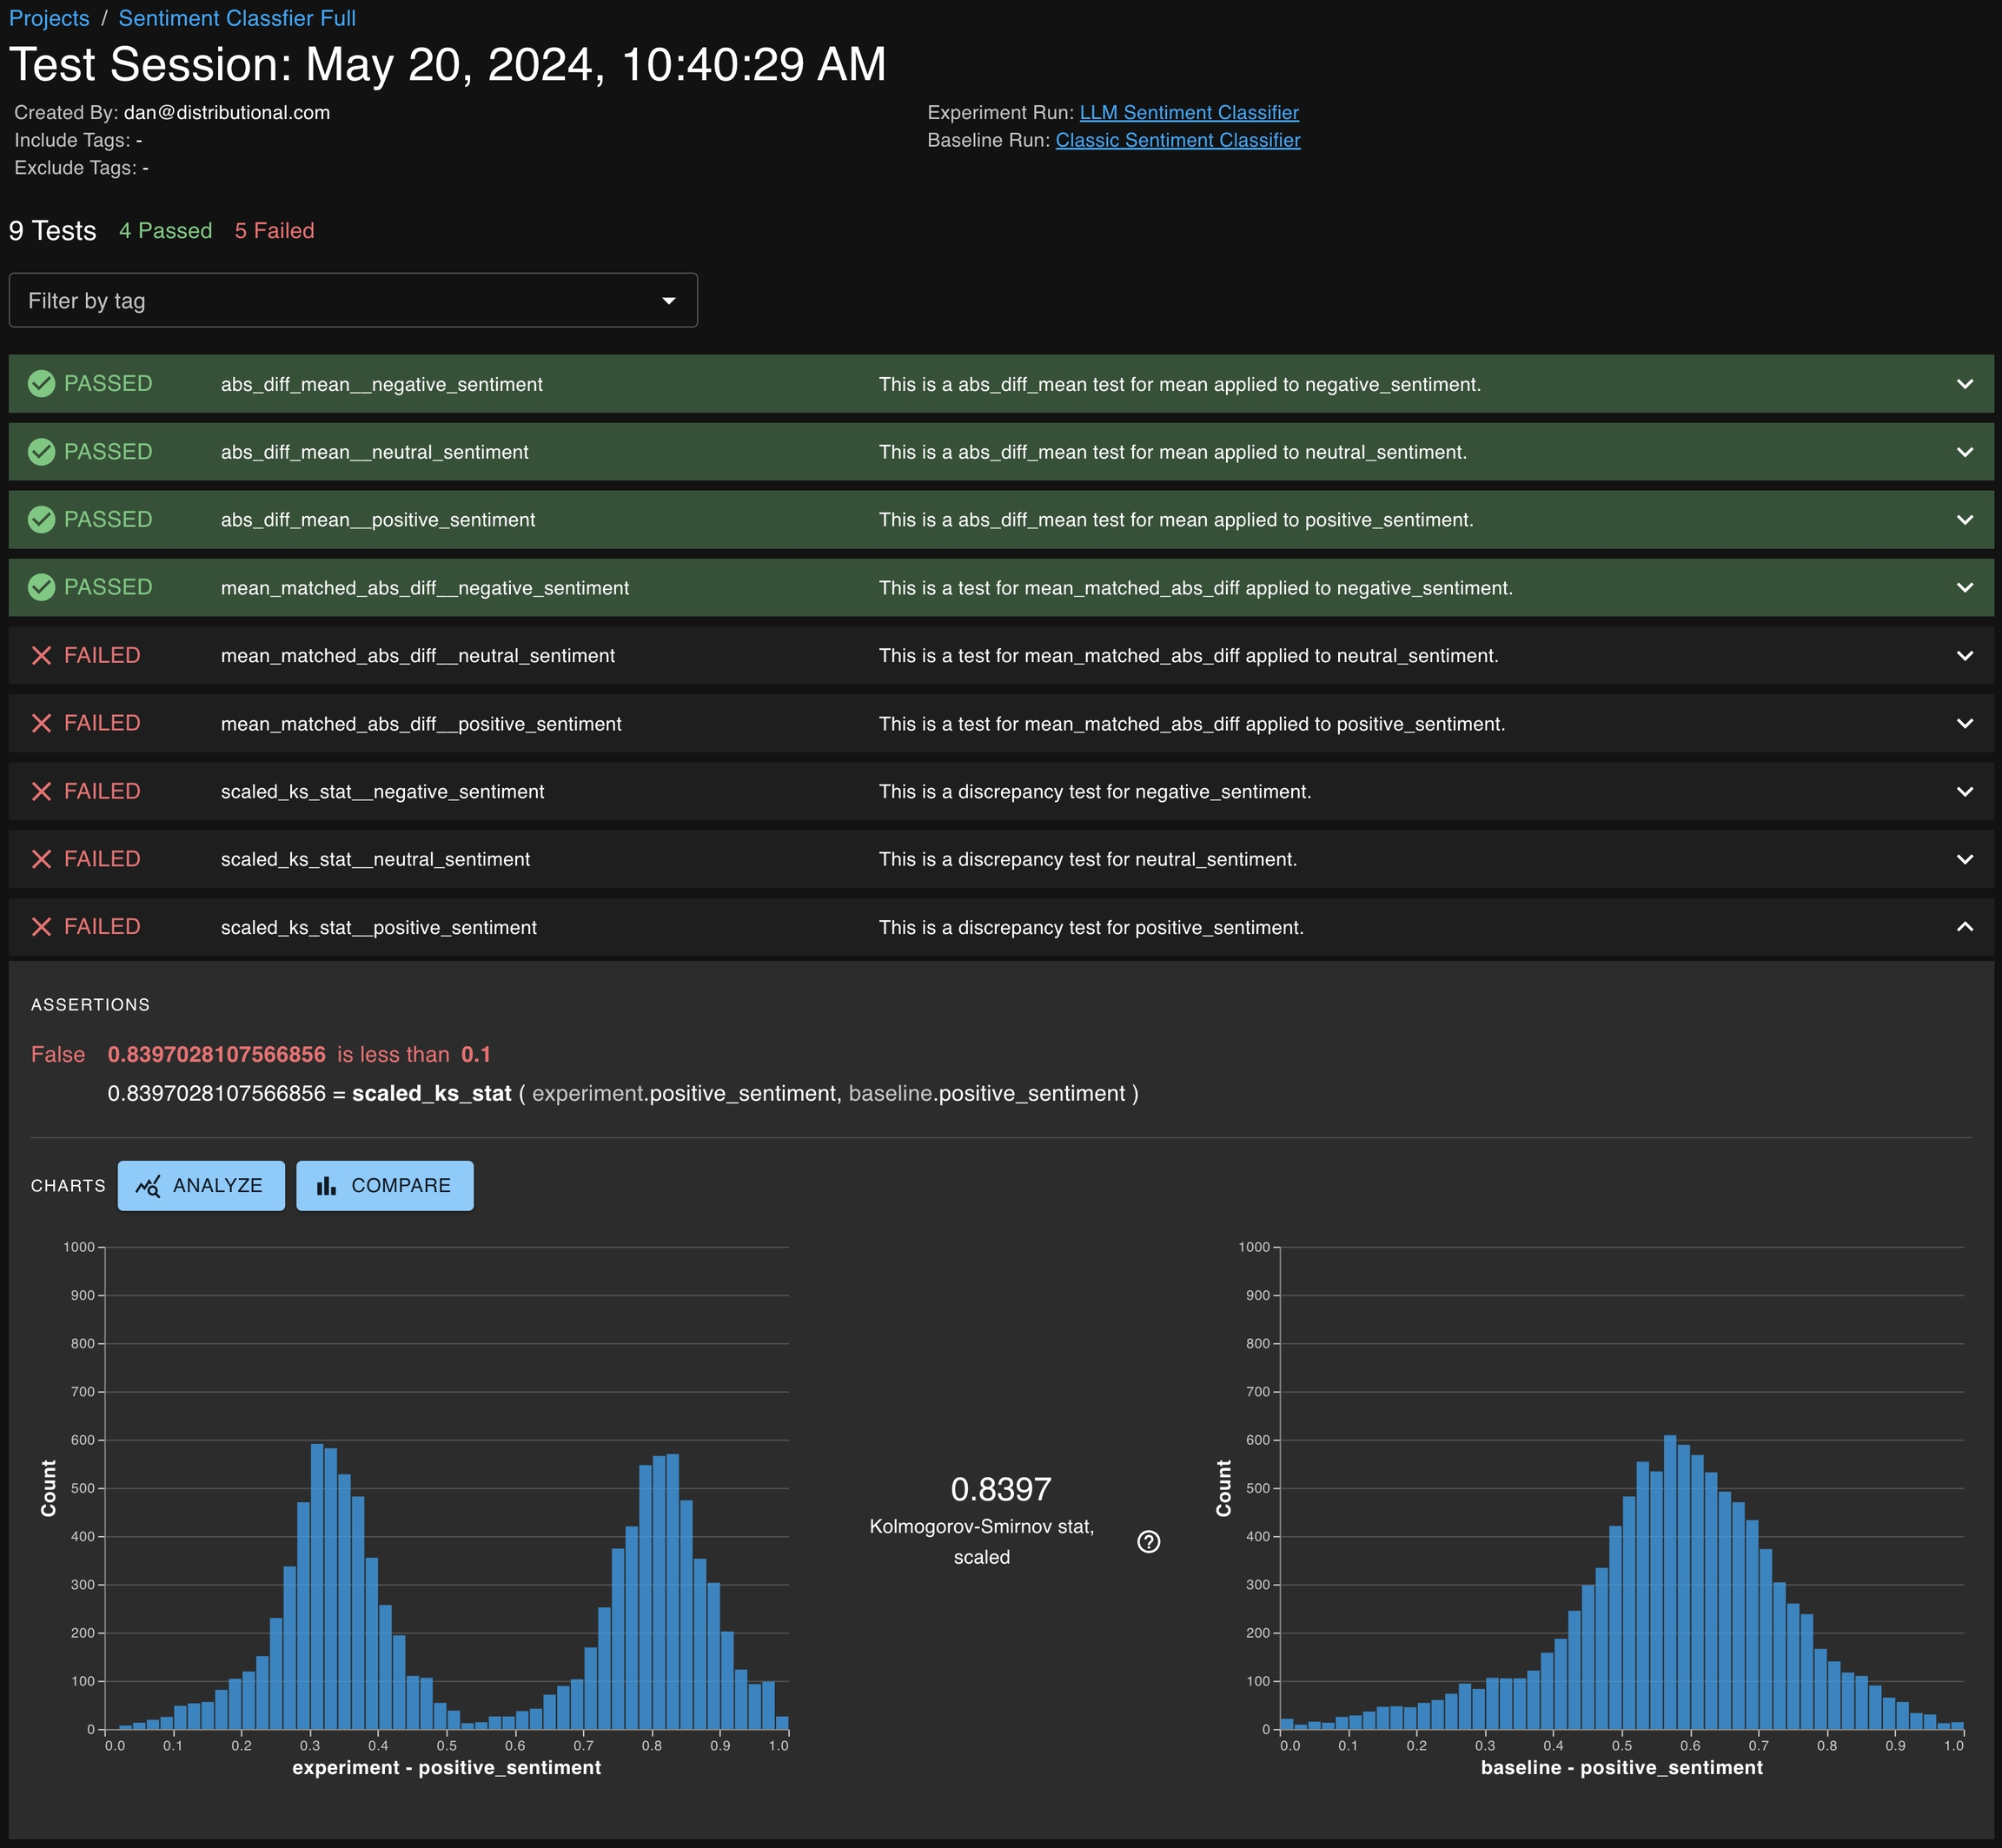
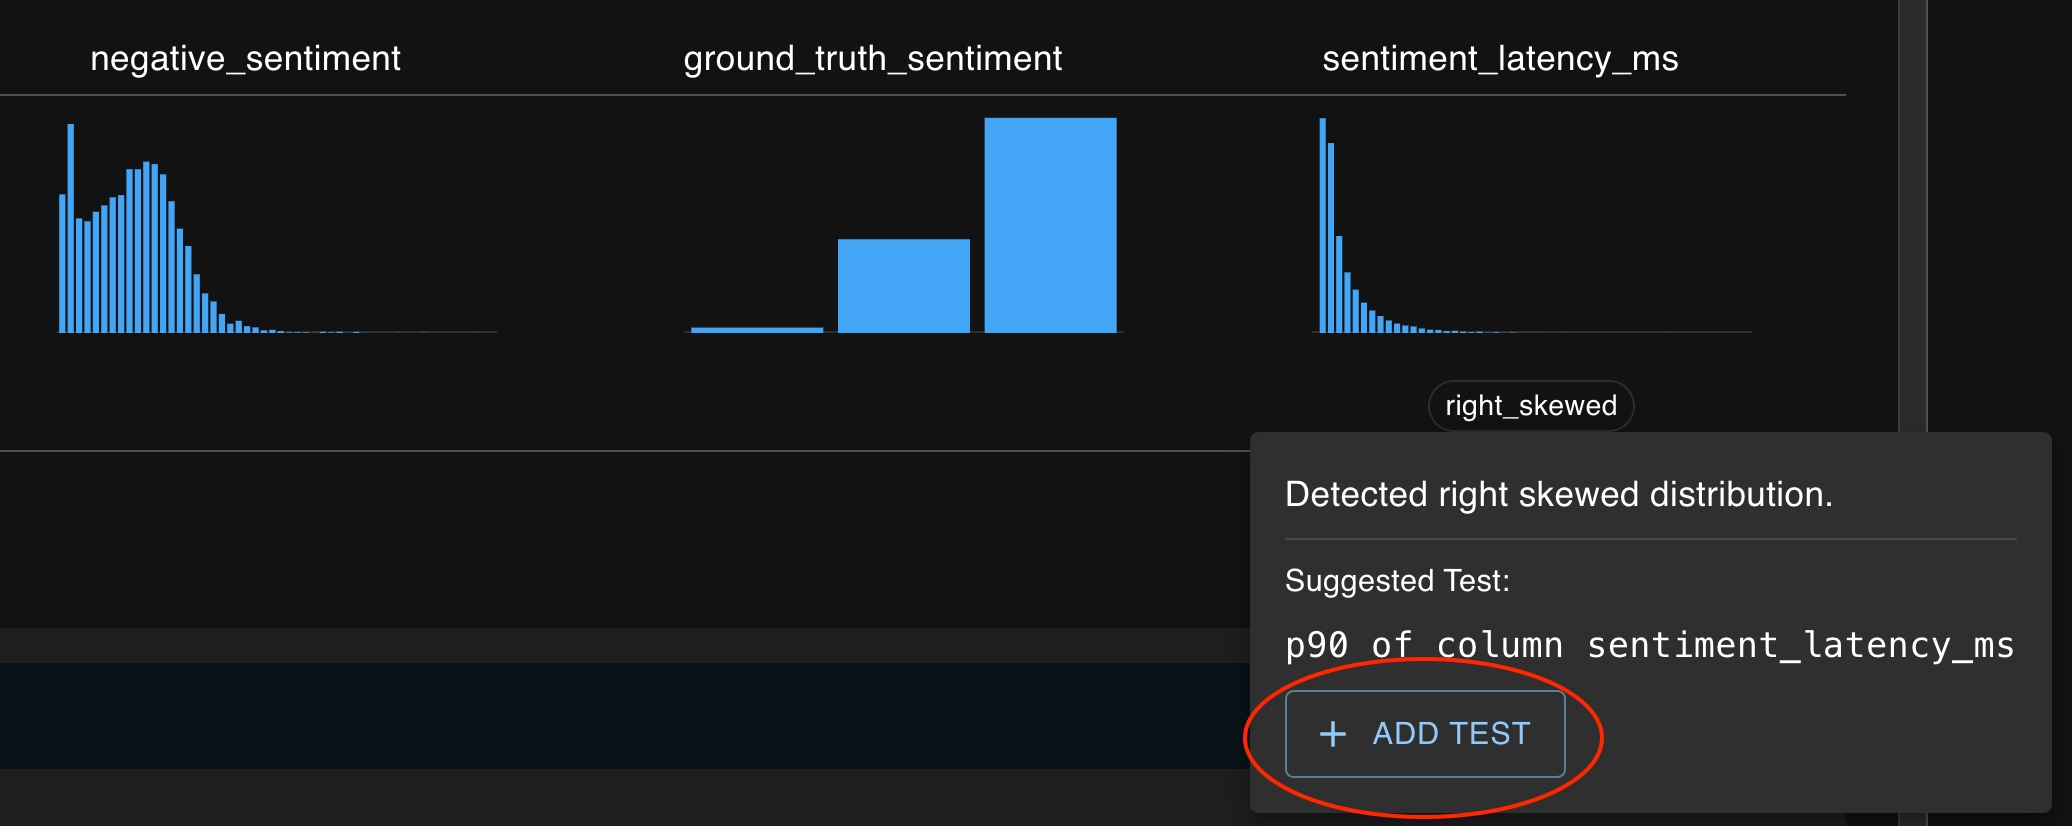
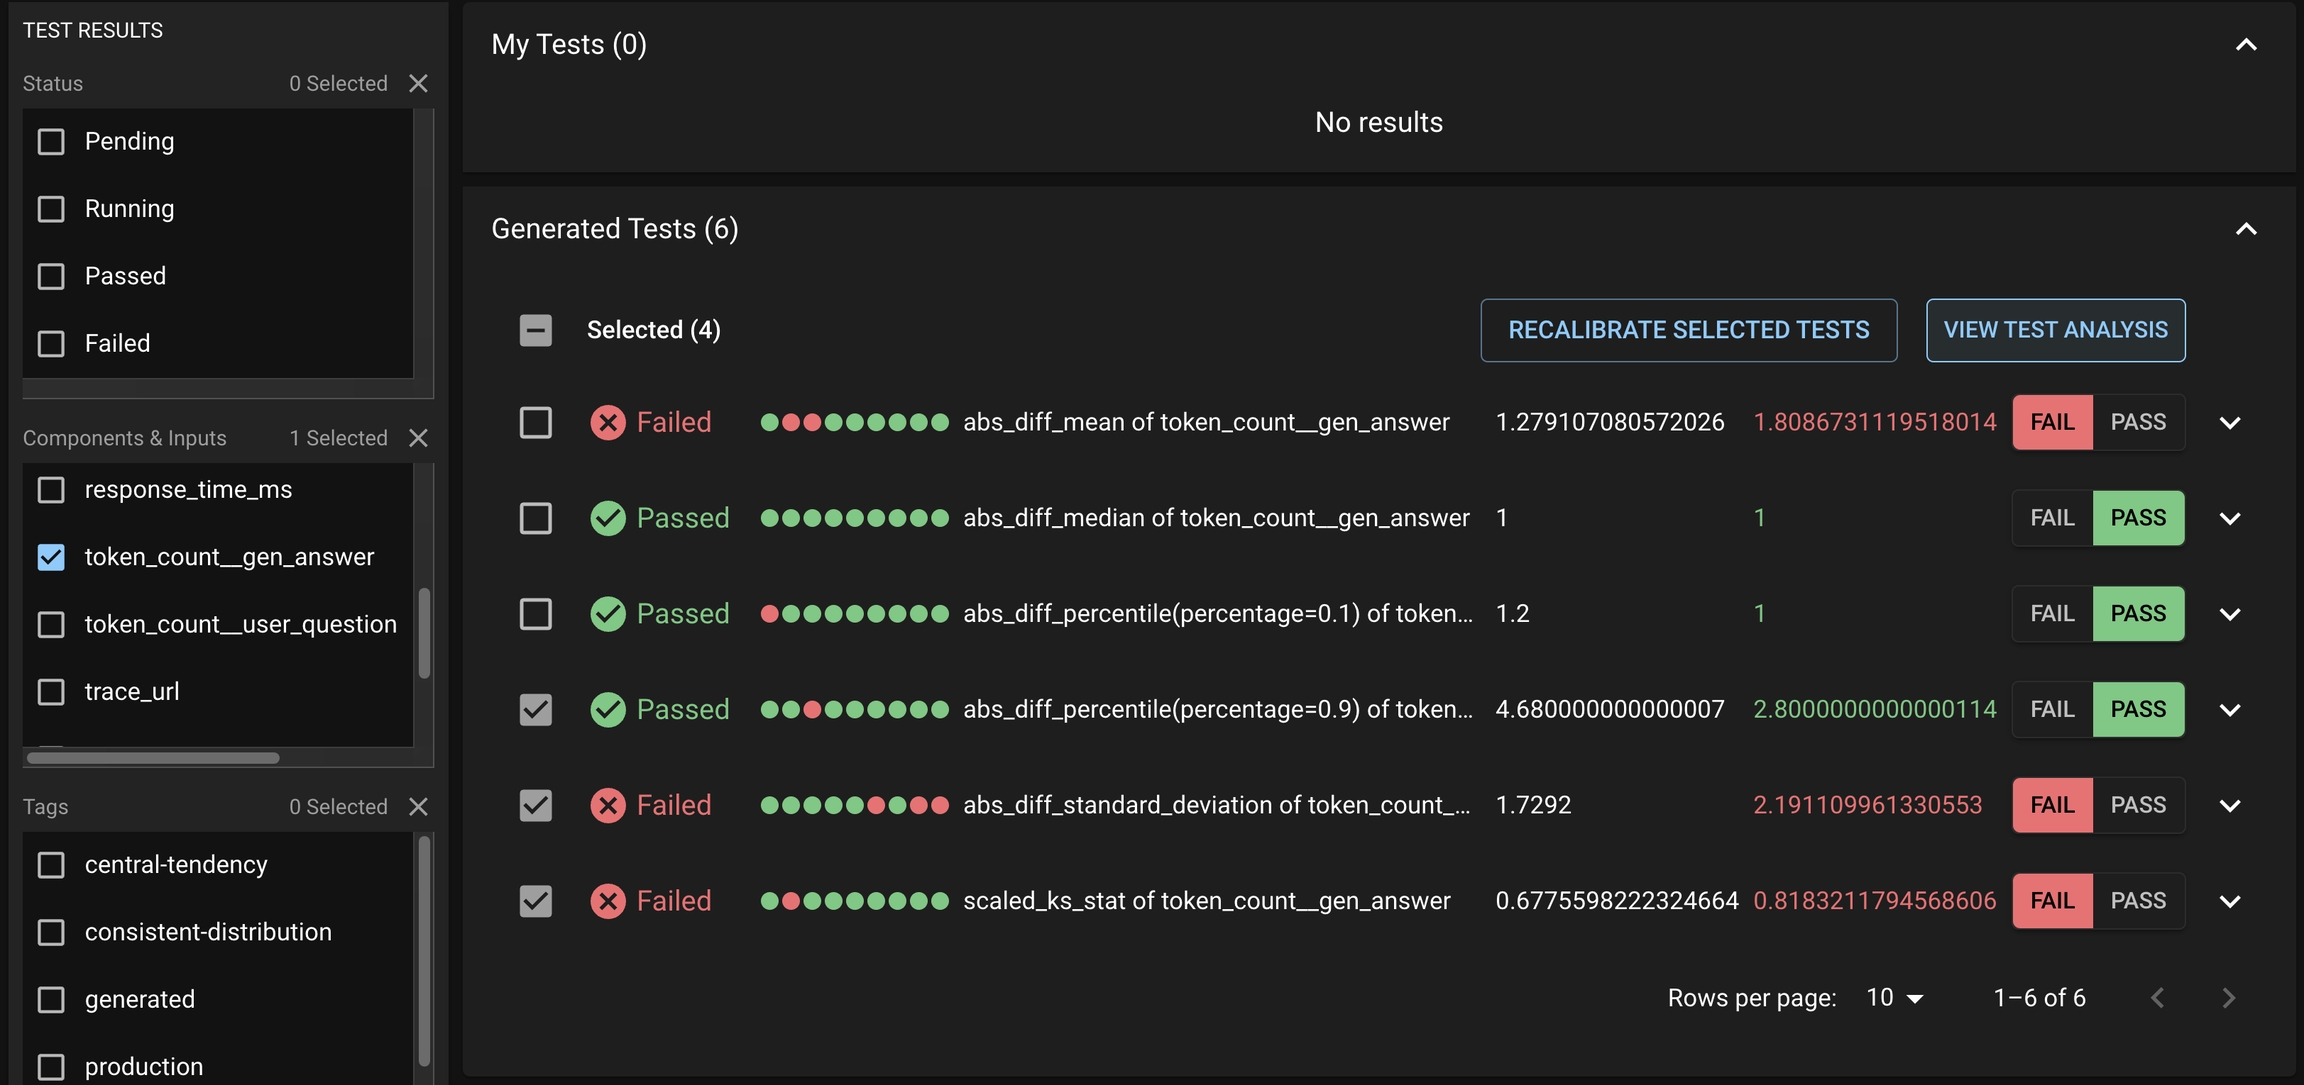
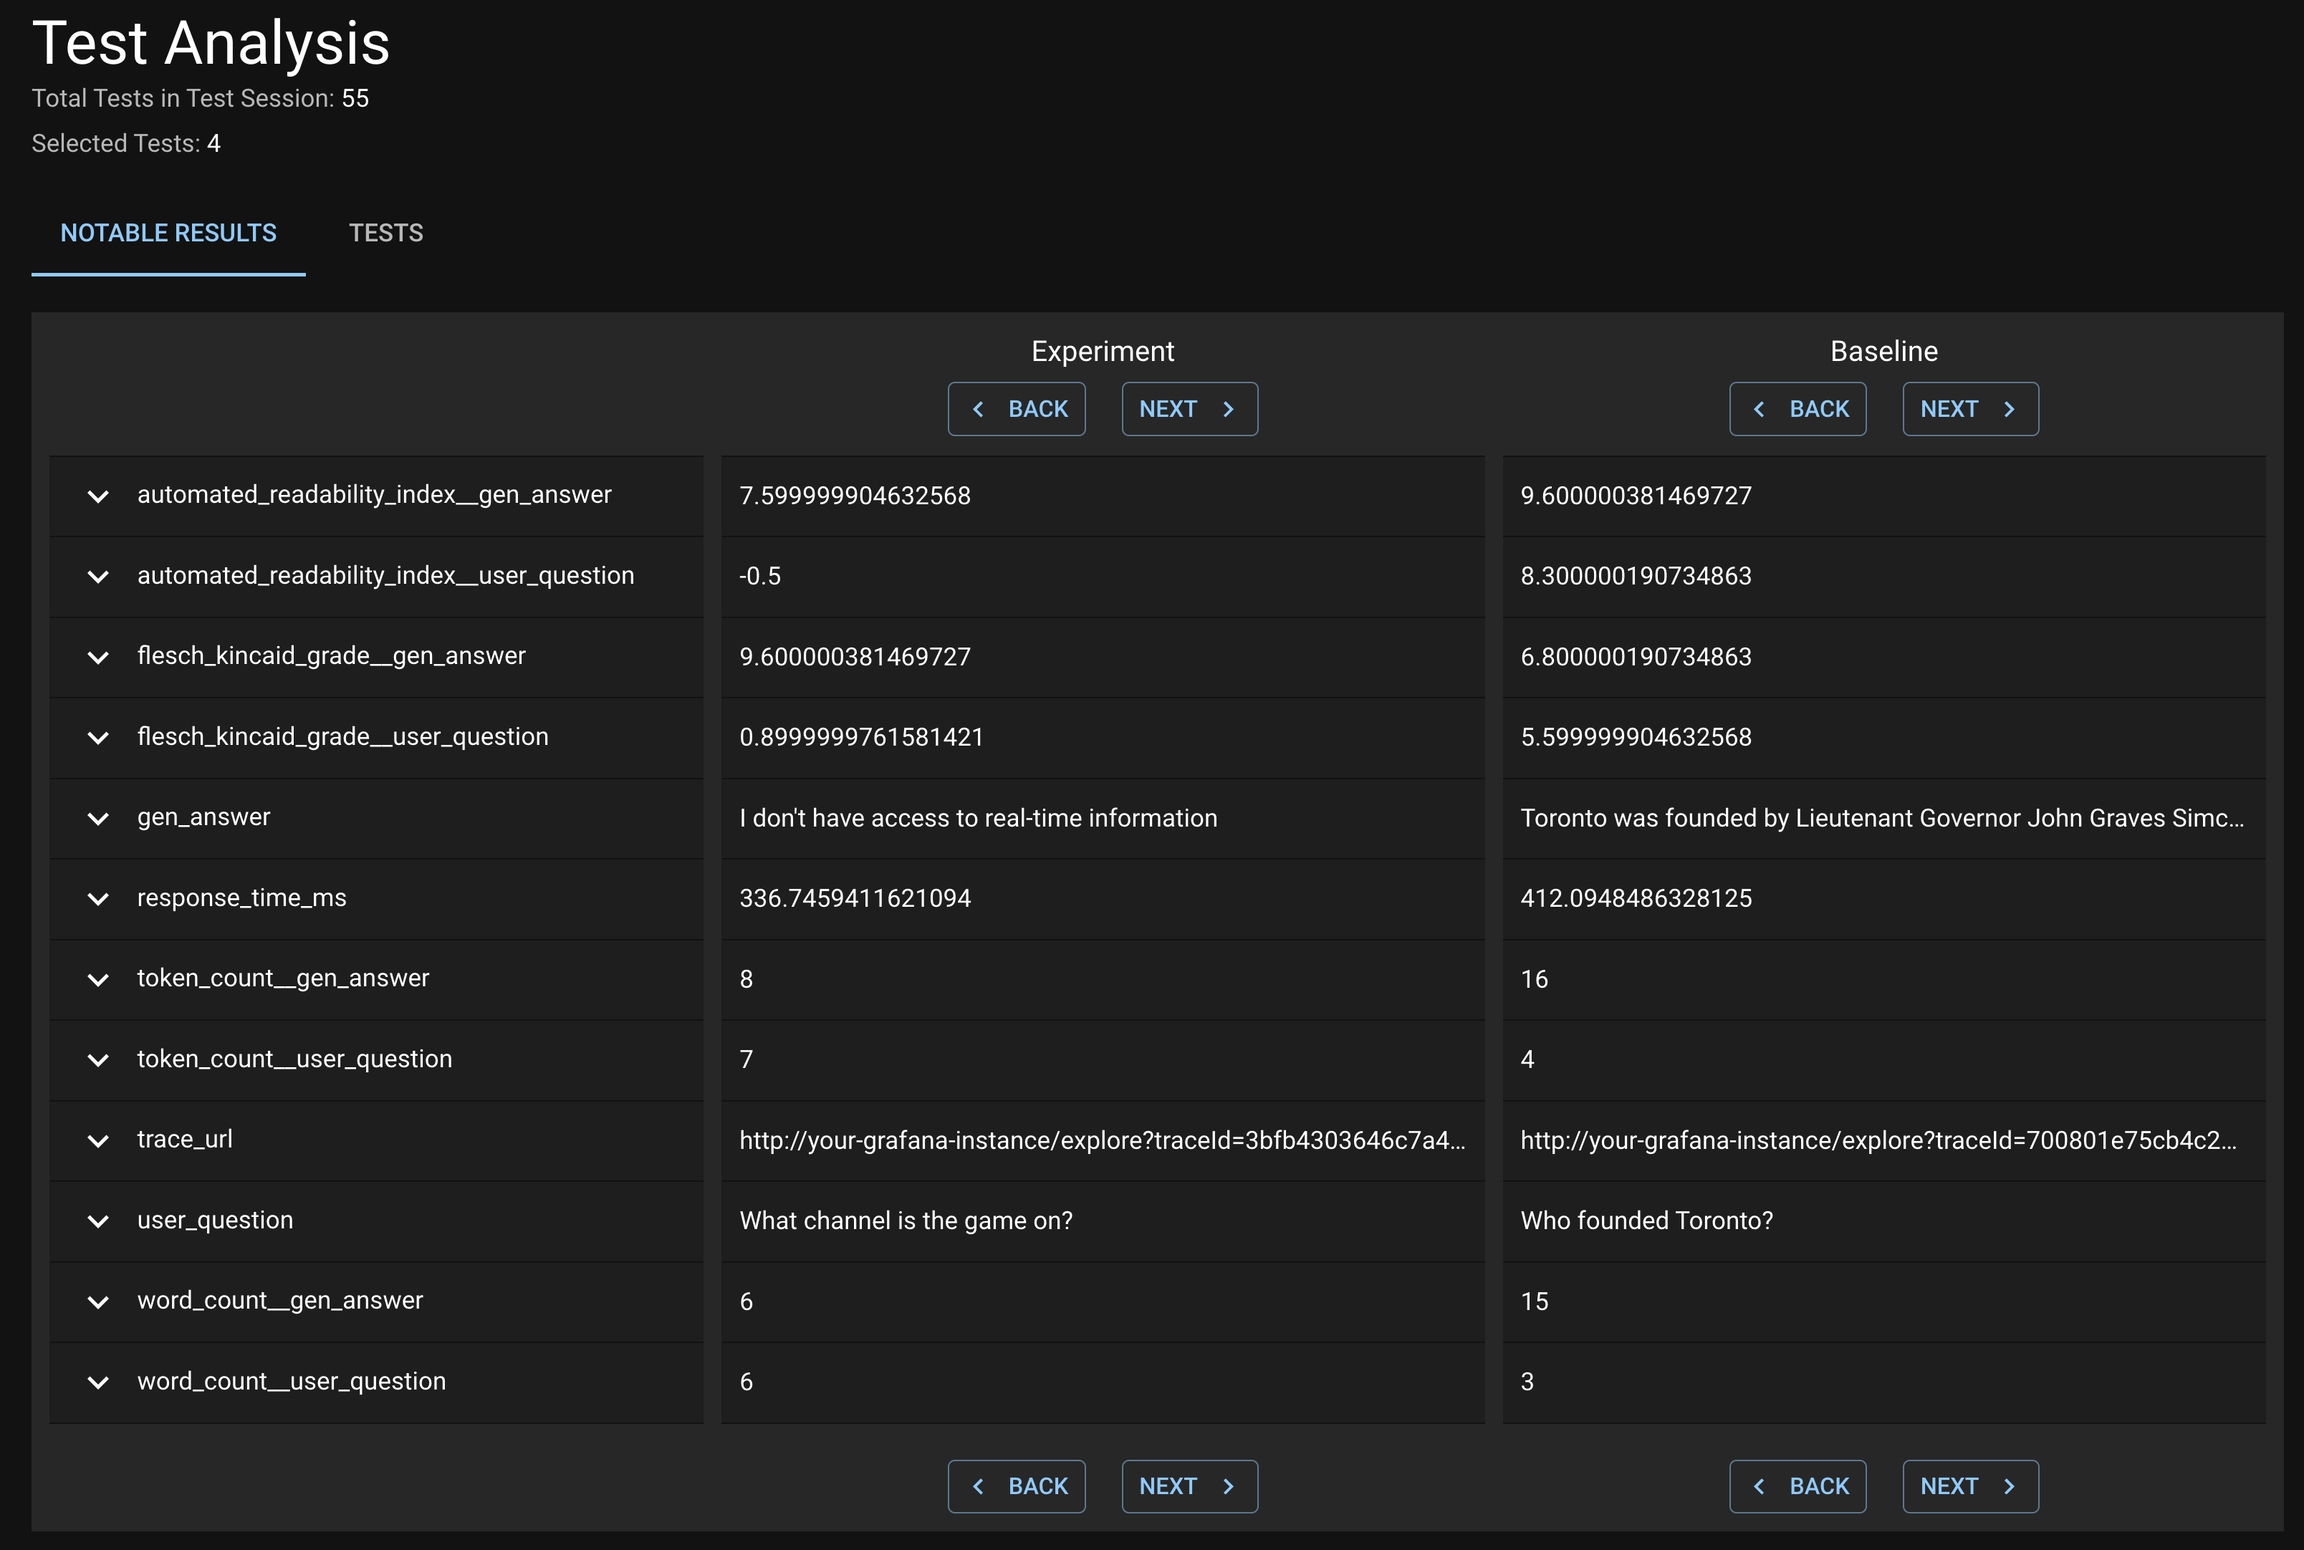
After a Test Session is executed, users might want to introspect on which Tests passed and failed. In addition, they want to understand what caused a Test or a group of Tests to fail; in particular, which subset of results from the Run likely caused the Tests to fail.
Notable results are only presented for Distributional generated tests
To review the notable results, first select the desirable set of Generated Tests that you want to study from the Test Session details page. This may include both failed and passed Tests.
Click VIEW TEST ANALYSIS button to enter the Test Analysis page. On this page, you can review the notable results for the Experiment Run and Baseline Run under the Notable Results tab.
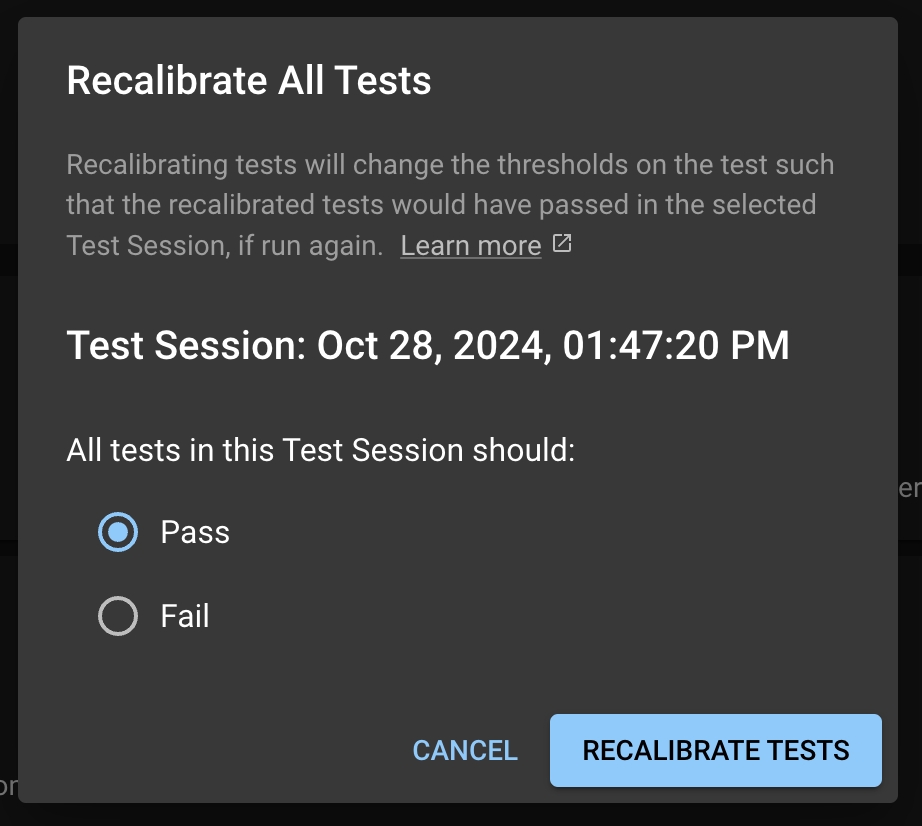
When Distributional automatically generates the production tests, the thresholds are estimated from a single Run’s data. As a consequence, some of these thresholds may not reflect the user’s actual working condition. As the user continues to upload Runs and triggers new Test Sessions, they may want to adjust these thresholds. The recalibration feature offers a simple option to adjust these thresholds.
Recalibration solicits feedback from the user and adjusts the test thresholds. If a user wants a particular test or set of tests to pass in the future, the test thresholds will be relaxed to increase the likelihood of the test passing with similar statistics.
Click the RECALIBRATE ALL TESTS button at the top right of the Generated Tests table in the Test Session page.
This will take you to the Test Configuration page, where it will prompt you with a modal for the you to select to have all the tests to pass or fail in the future.
First select the tests you want to recalibrate, then click the RECALIBRATE <#> TESTS button under the Generated Tests tab. This will prompt the same modal for the user to select to have these tests pass or fail in the future.
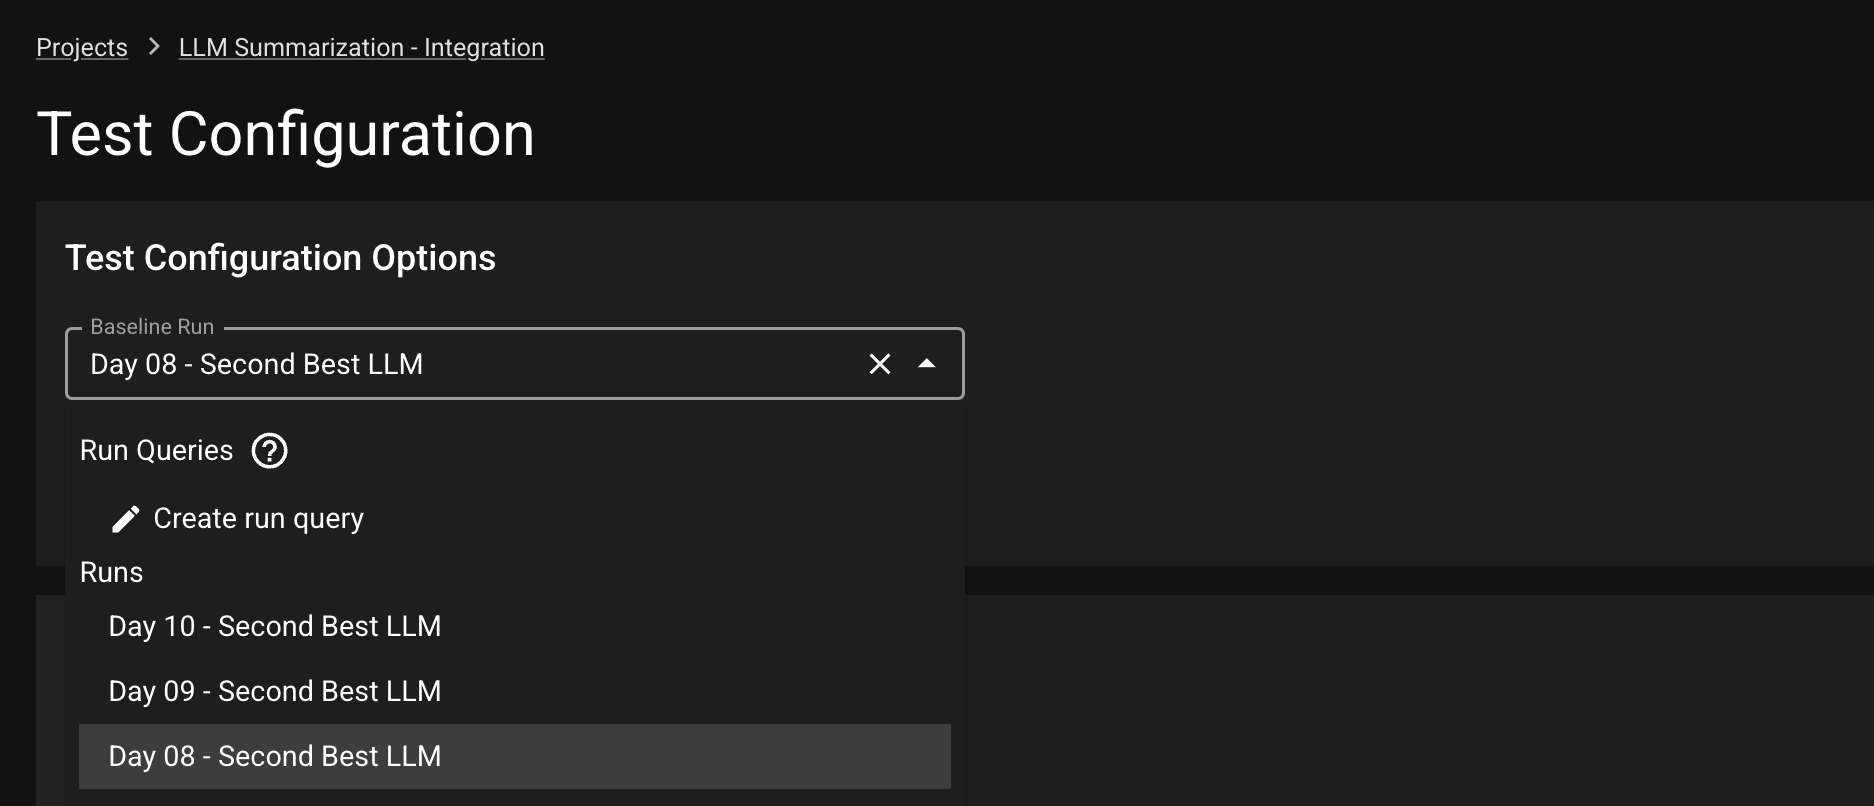
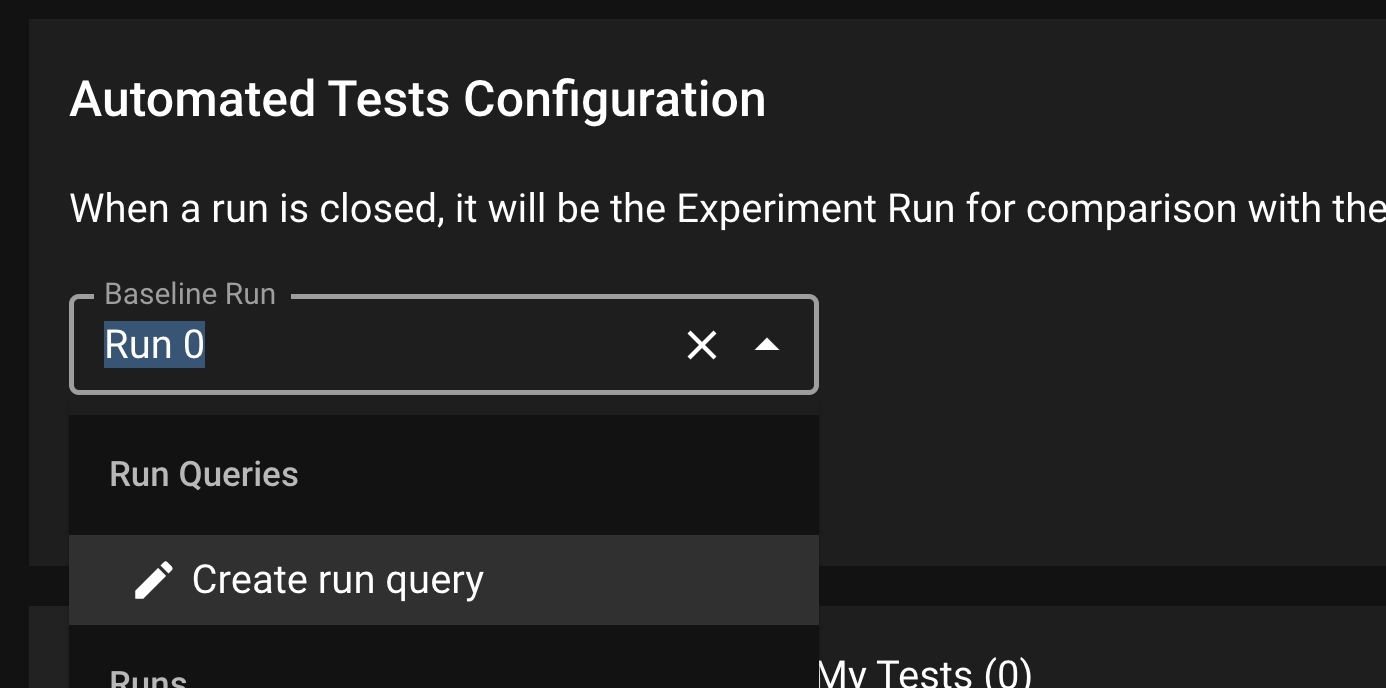
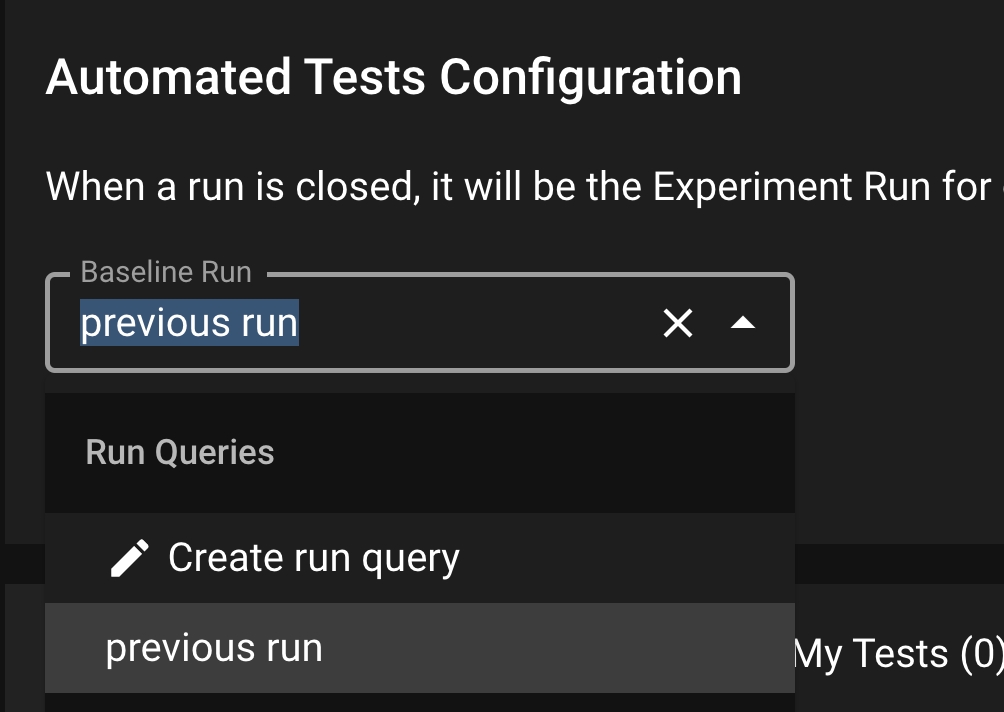
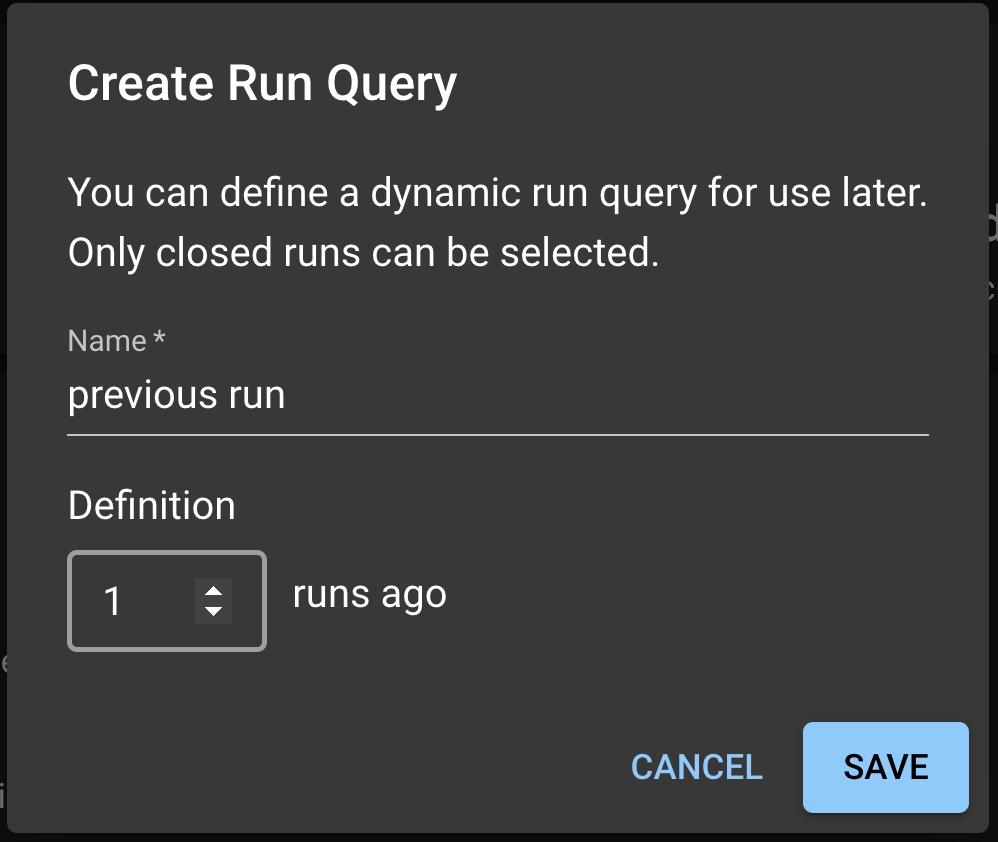
Instead of comparing the newest Run to a fixed Baseline Run, a user might want to dynamically shift the baseline. For example, one might want to compare the new Run to the most recently completed Run. To enable dynamic baseline, user needs to create a Run Query from the Test Config page.
Under the Baseline Run dropdown, select Create run query; this will prompt a Run Query modal. In the model, you can write the name of the Run Query and select the offsetting Run to be used for the dynamic baseline. For example: 1 implies each new Run is tested against the previous uploaded Run.
Click SAVE to save this Run Query. Back in the Test Config page, select the Run Query from the dropdown and click SAVE to save this setting as the dynamic baseline.
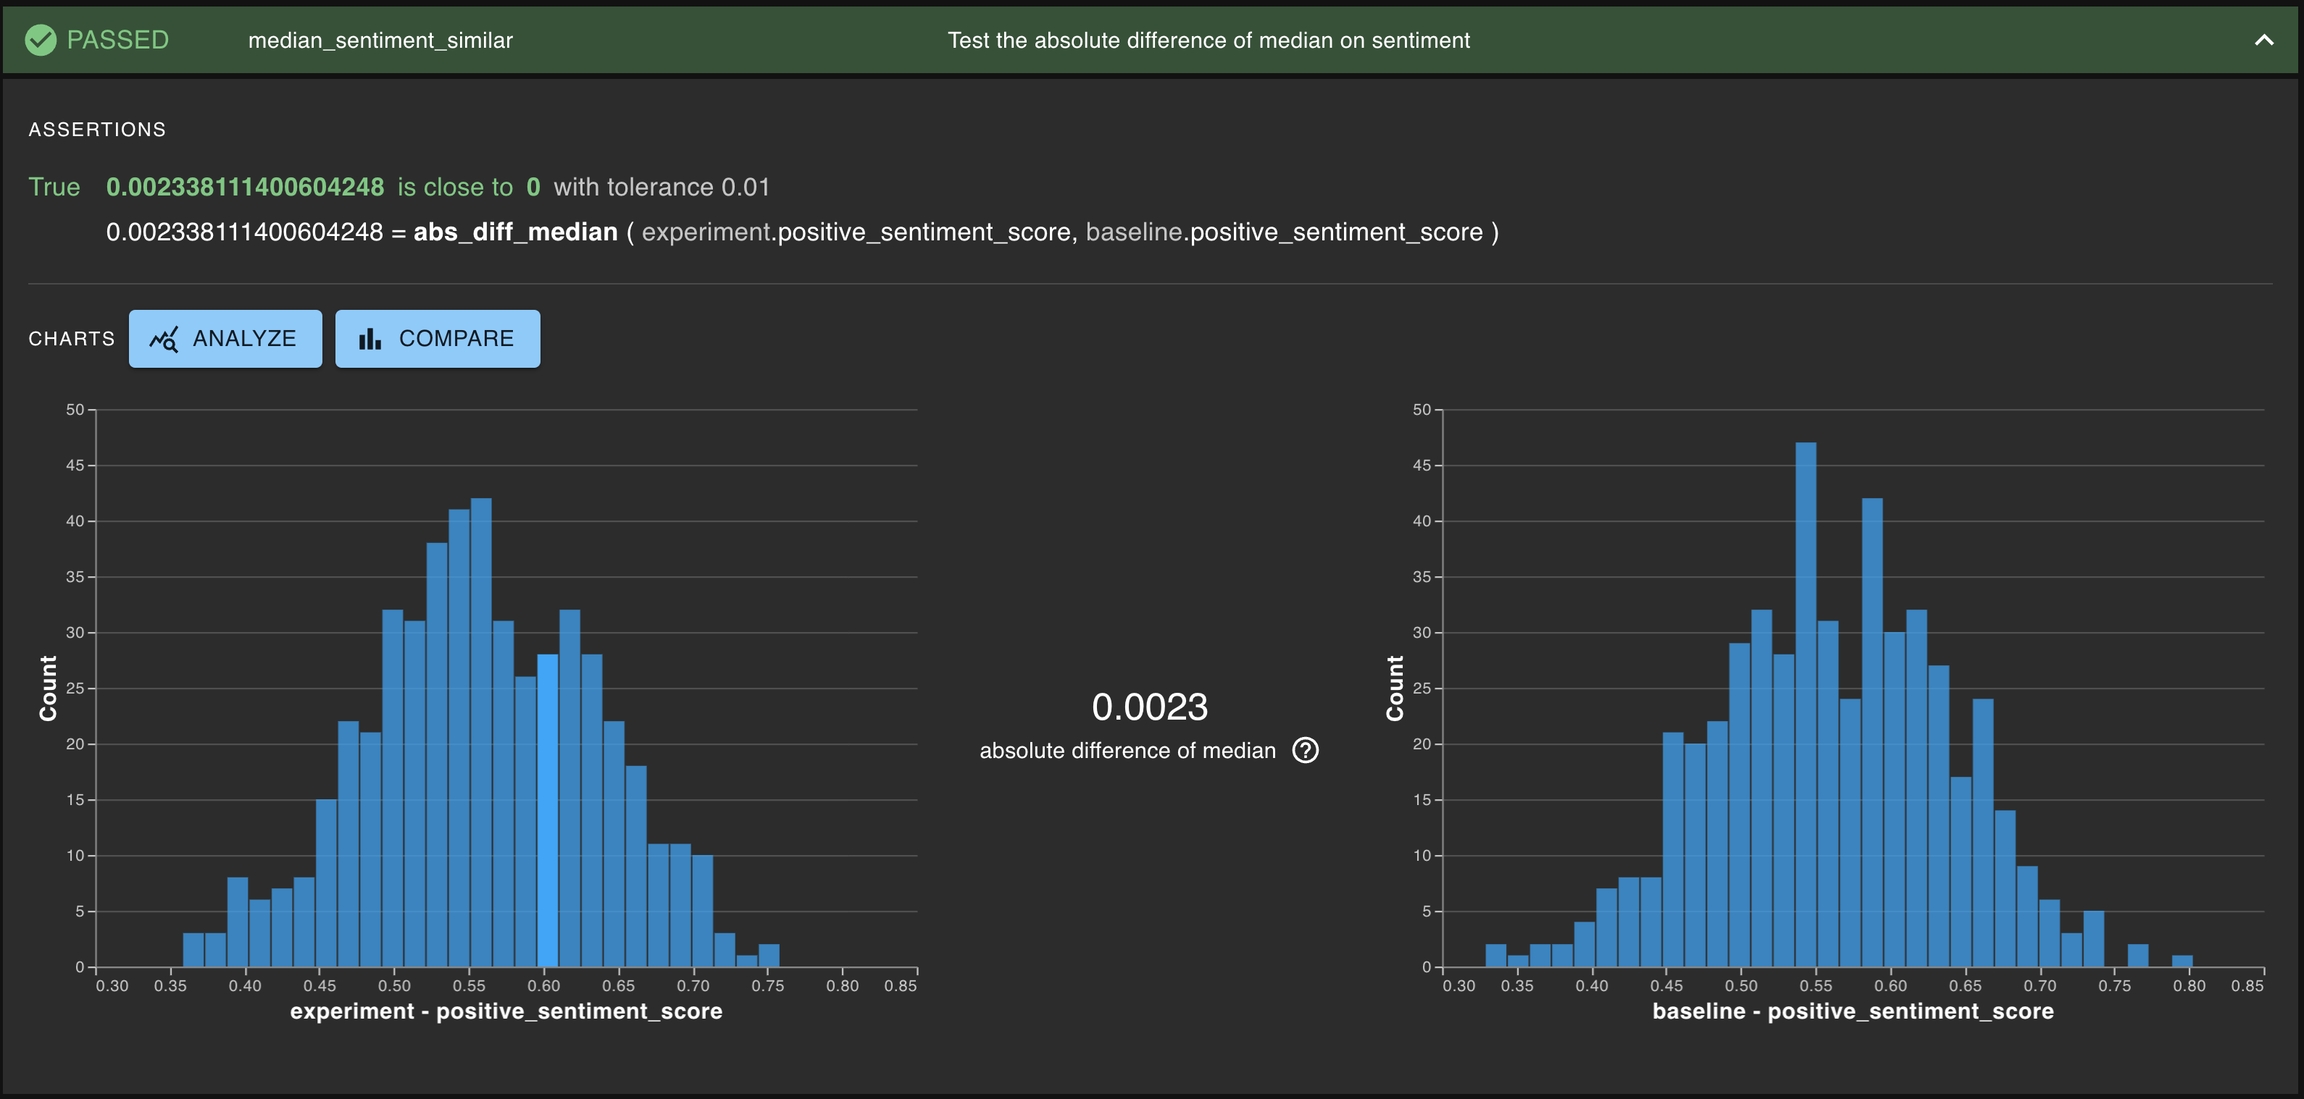
Another type of test is testing if a particular statistic is similar for two different distributions. For example, this can be testing if the absolute difference of medians of sentiment score between the experiment run and the baseline run is small — that is, the scores are close to one another.
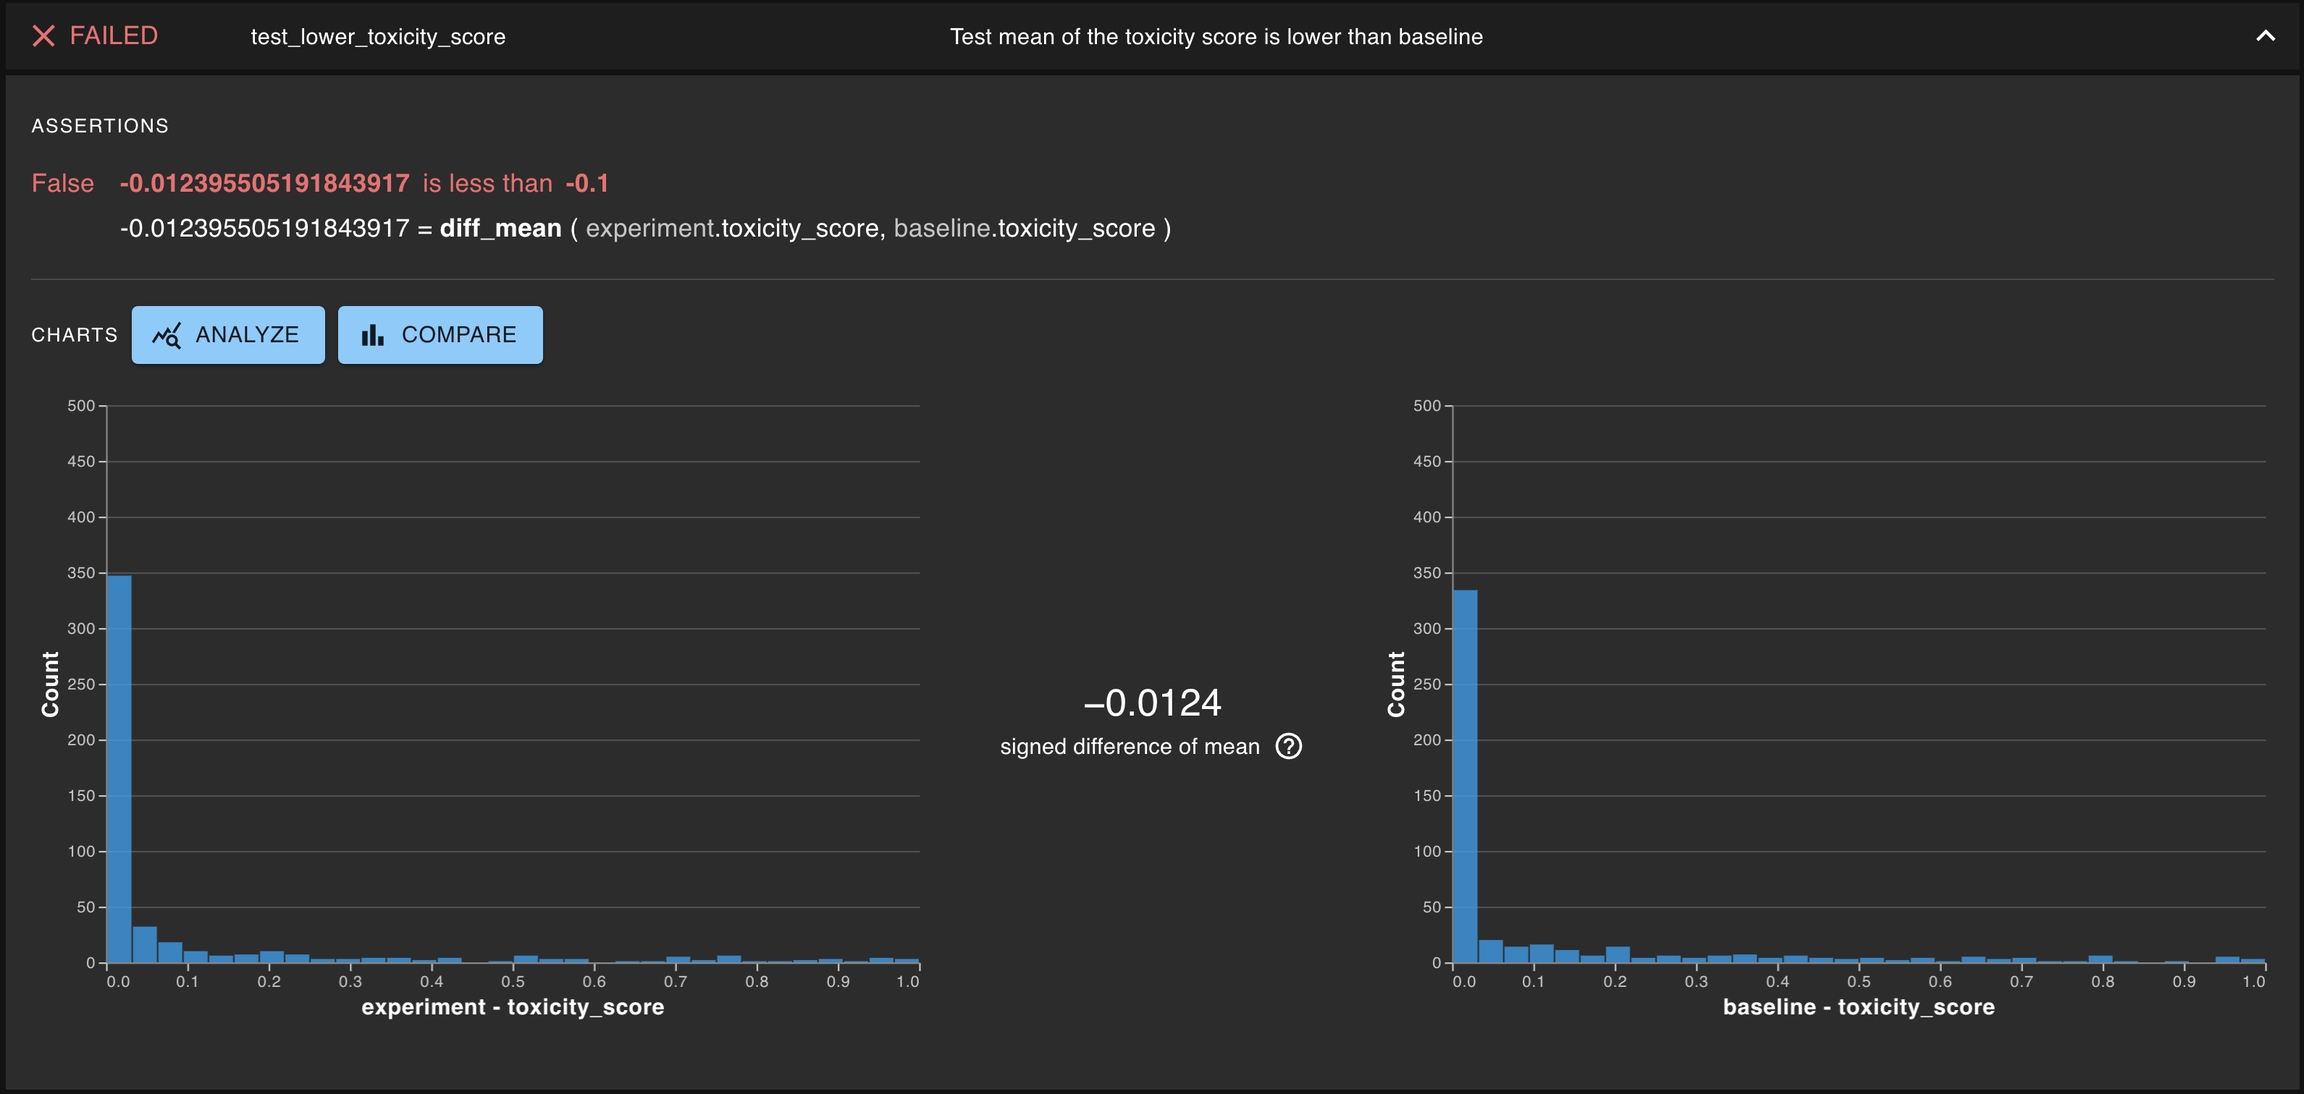
A common type of test is testing whether a single distribution contains some property of interest. Generally, this means determining whether some statistics for the distribution of interest exceeds some threshold. Some examples of this can be testing the toxicity of a given LLM or the latency for the entire AI-powered application.
This is especially common for development testing, where it is important to test if a proposed app reaches the minimum threshold for what is acceptable.
One general approach to test if two columns are similarly distributed is using a nonparametric statistic. DBNL offers two such statistics: scaled_ks_stat for testing ordinal distributions and scaled_chi2_stat for testing nominal distributions.
Another testing case is testing whether two distributions are not the same. Such a test involves the same statistics as a test of consistency, but a different assertion. One example could be to change the assertion from close_to to greater_than and thereby state that a passed test requires a difference bigger than some threshold.
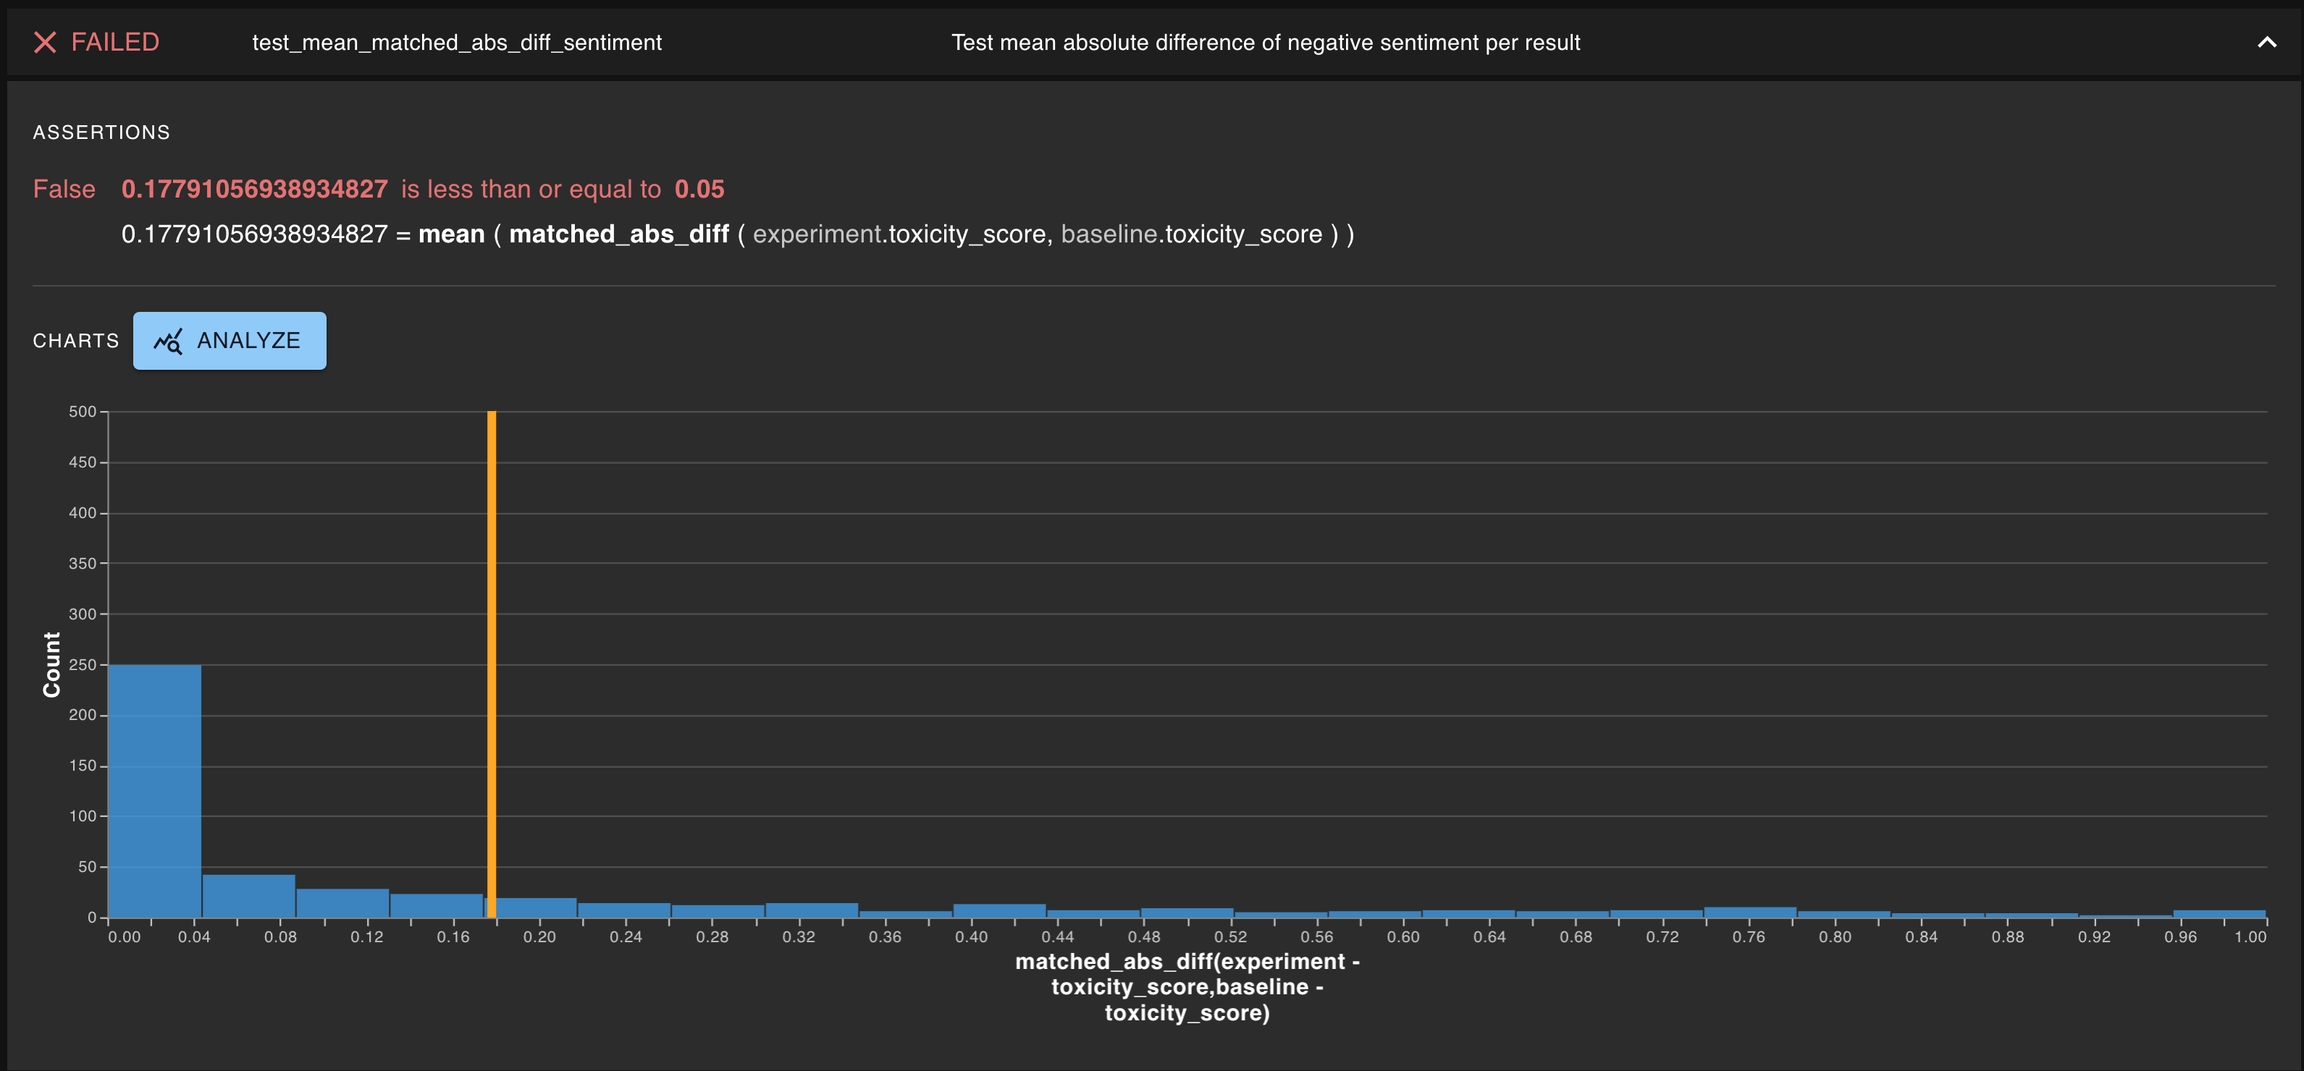
When the results from a run have unique identifiers, one can create a special type of tests for testing matching behavior at a per-result level. One example would be testing the mean of per-result absolute difference does not exceed a threshold value.
Distributional allows users to apply filters on run data they have uploaded. Applying a filter selects for only the rows that match the filter criteria. The filtered rows can then be visualized or used to create tests.
We will show how filters can be used to explore the data created by the and build filtered tests.
After tests are created for an associated project, there are two ways that they can be executed.
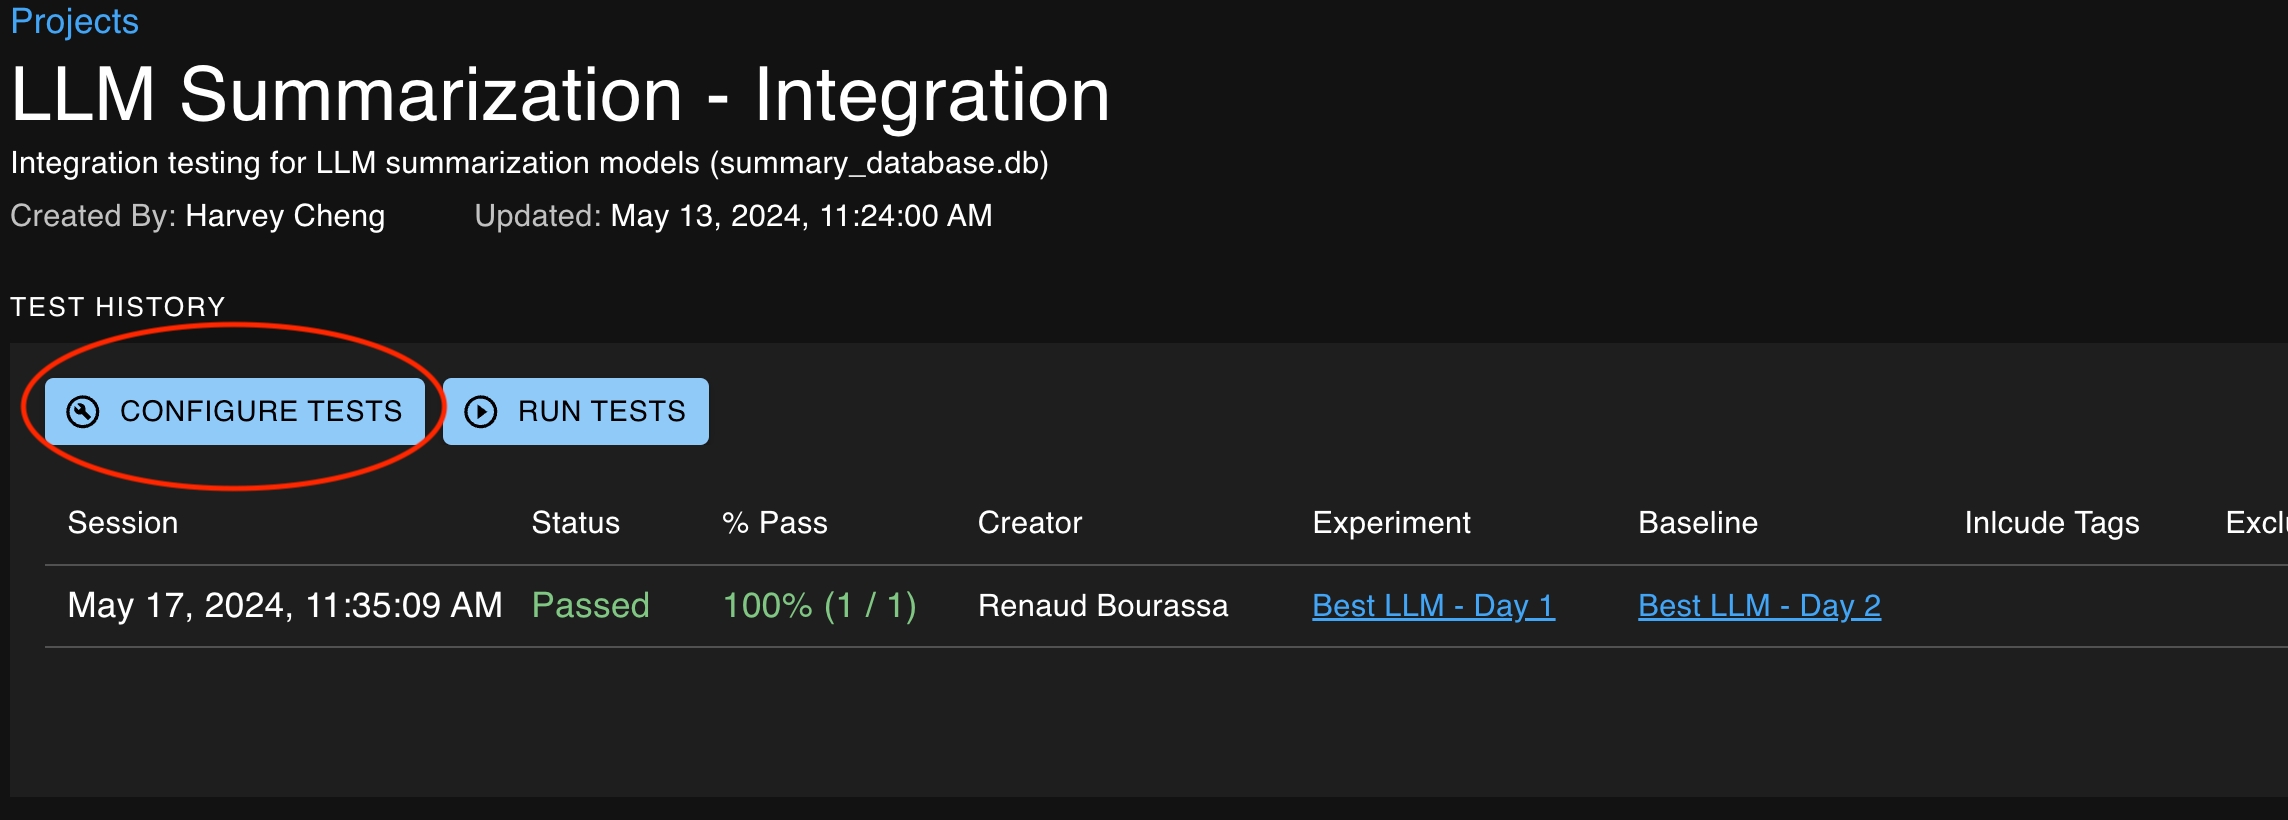
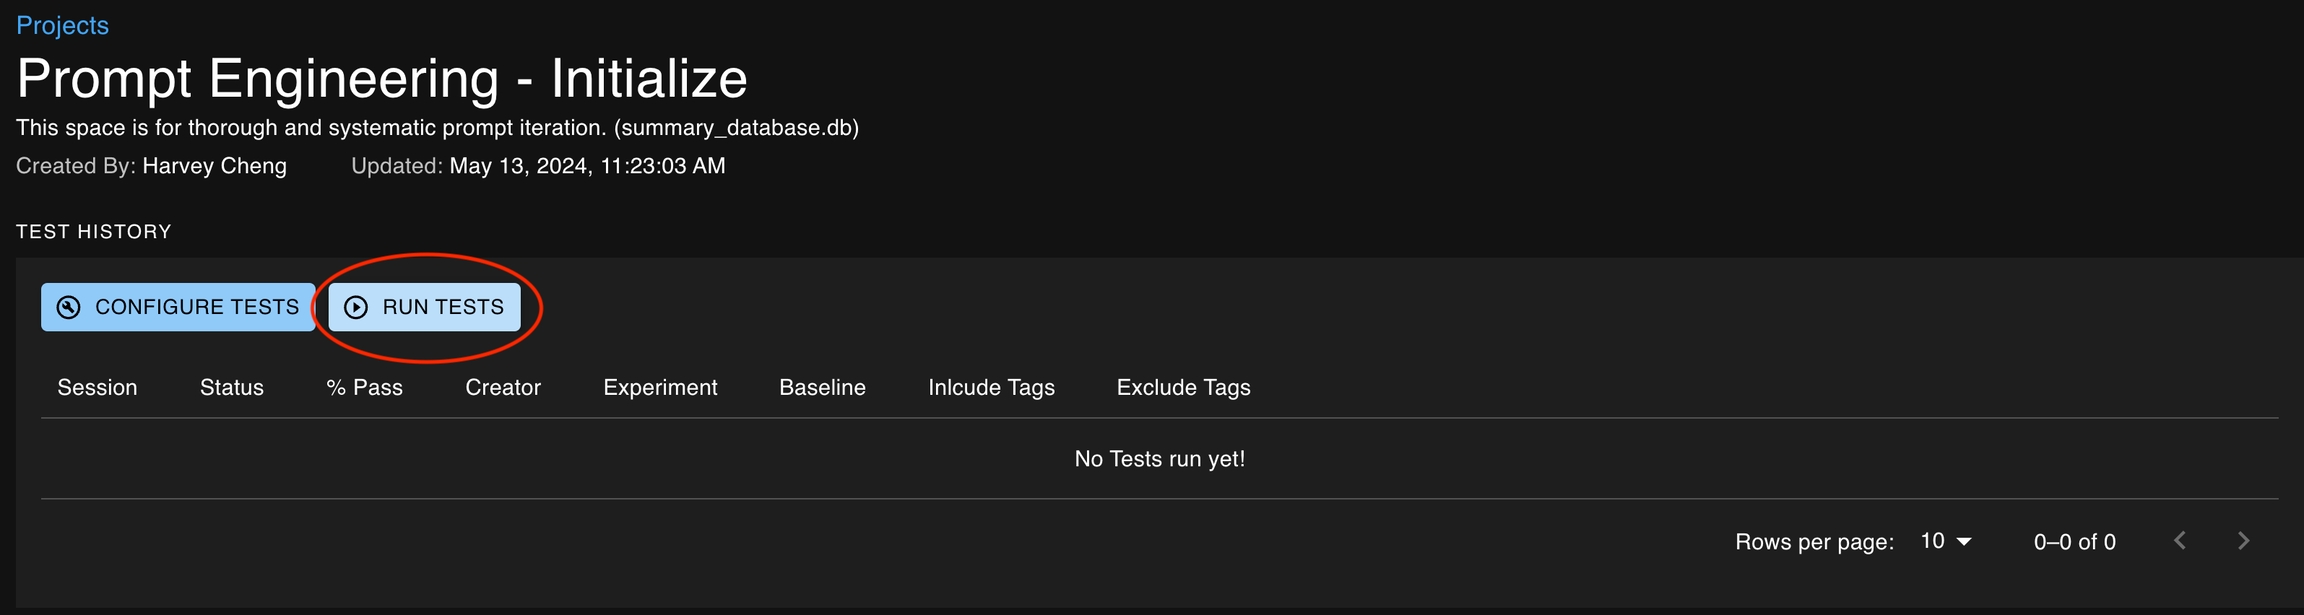
Manually via the UI on the Project Details page
Via the SDK using the create_test_session method
After the tests have been executed, what comes next?
Executing tests creates a Test Session, which summarizes the specified tests associated with the session, specifically highlighting whether each test’s assertion has passed or failed.
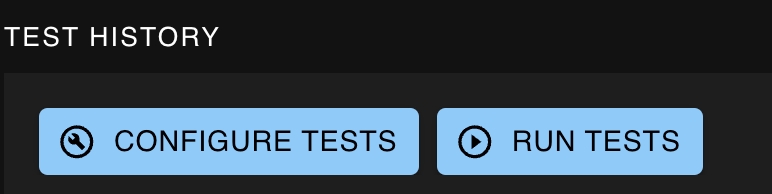
The Test History section of the Project Detail pages is a record of all the test sessions created over time. Each row of the Test History table represents a Test Session. You can click anywhere on a Test Session row to navigate to the Test Session Detail page where more detailed information for each test can be viewed.
Tests can also be executed via the SDK after results data has been reported. This requires the following steps.
Alternatively, you can also set a Run as baseline using the set_run_as_baseline function.
Executing the close_run command for a new run in that same project will finalize the data, enabling it for use in Tests.
Execute the create_test_session command, providing your new run as the "experiment". Tests will then use the previously-defined baseline for comparisons.
You can choose to run tests associated with a project by clicking on the Run Tests button on the project details page. This button will open up a modal that allows you to specify the baseline and experiment runs as well as the tags of the tests you would like to include or exclude from the test session.
Filters can be written at the top of the compare page, which is accessible from the project detail page. Users write filters to select for only the rows they wish to visualize / inspect.
Below is a list of DBNL defined functions that can be used in filter expressions:
and
Logical AND operation of two or more boolean columns
or
Logical OR operation of two or more boolean columns
not
Logical NOT operation of a boolean column
less_than
['lt']
Computes the element-wise less than comparison of two columns. input1 < input2
less_than_or_equal_to
['lte']
Computes the element-wise less than or equal to comparison of two columns. input1 <= input2
greater_than
['gt']
Computes the element-wise greater than comparison of two columns. input1 > input2
greater_than_or_equal_to
['gte']
Computes the element-wise greater than or equal to comparison of two columns. input1 >= input2
equal_to
['eq']
Computes the element-wise greater than or equal to comparison of two columns
Here is an example of a more complicated filter that selects for rows that have their loc column equal to the string 'NY' and their respective churn_score > 0.9:
Use single quotes ' for filtering of string variables.
Filters can also be used to specify a sub-selection of rows in runs you would like to include in the test computation.
For example, our goal could be to create a test that asserts that, for rows where the loc column is ‘NY’, the absolute difference of means of the correct churn predictions is <= 0.2 between baseline and experiment runs.
We will walk through how this can be accomplished:
1. Navigate to the Project Detail page and click on “Configure Tests”.
Click Add Test on the Test Configuration page. Don’t forget to also set a baseline run for automated test configuration.
Create the test with the filter specified on the baseline and experiment run.
Filter for the baseline Run:
Filter for the experiment Run:
4. You can now see the new test in the Test Configuration Page. When new data is uploaded, this test will automatically run and compare the new run (as experiment) against the selected baseline run.
When new run data is uploaded, this test will run automatically and use the defined filters to sub-select for the rows that have the loc column equal to ‘NY’.
The full Test Spec in JSON format is shown below.