> For the complete documentation index, see [llms.txt](https://docs.dbnl.com/llms.txt). Markdown versions of documentation pages are available by appending `.md` to page URLs; this page is available as [Markdown](https://docs.dbnl.com/v0.29.x/workflow/logs.md).
# Logs
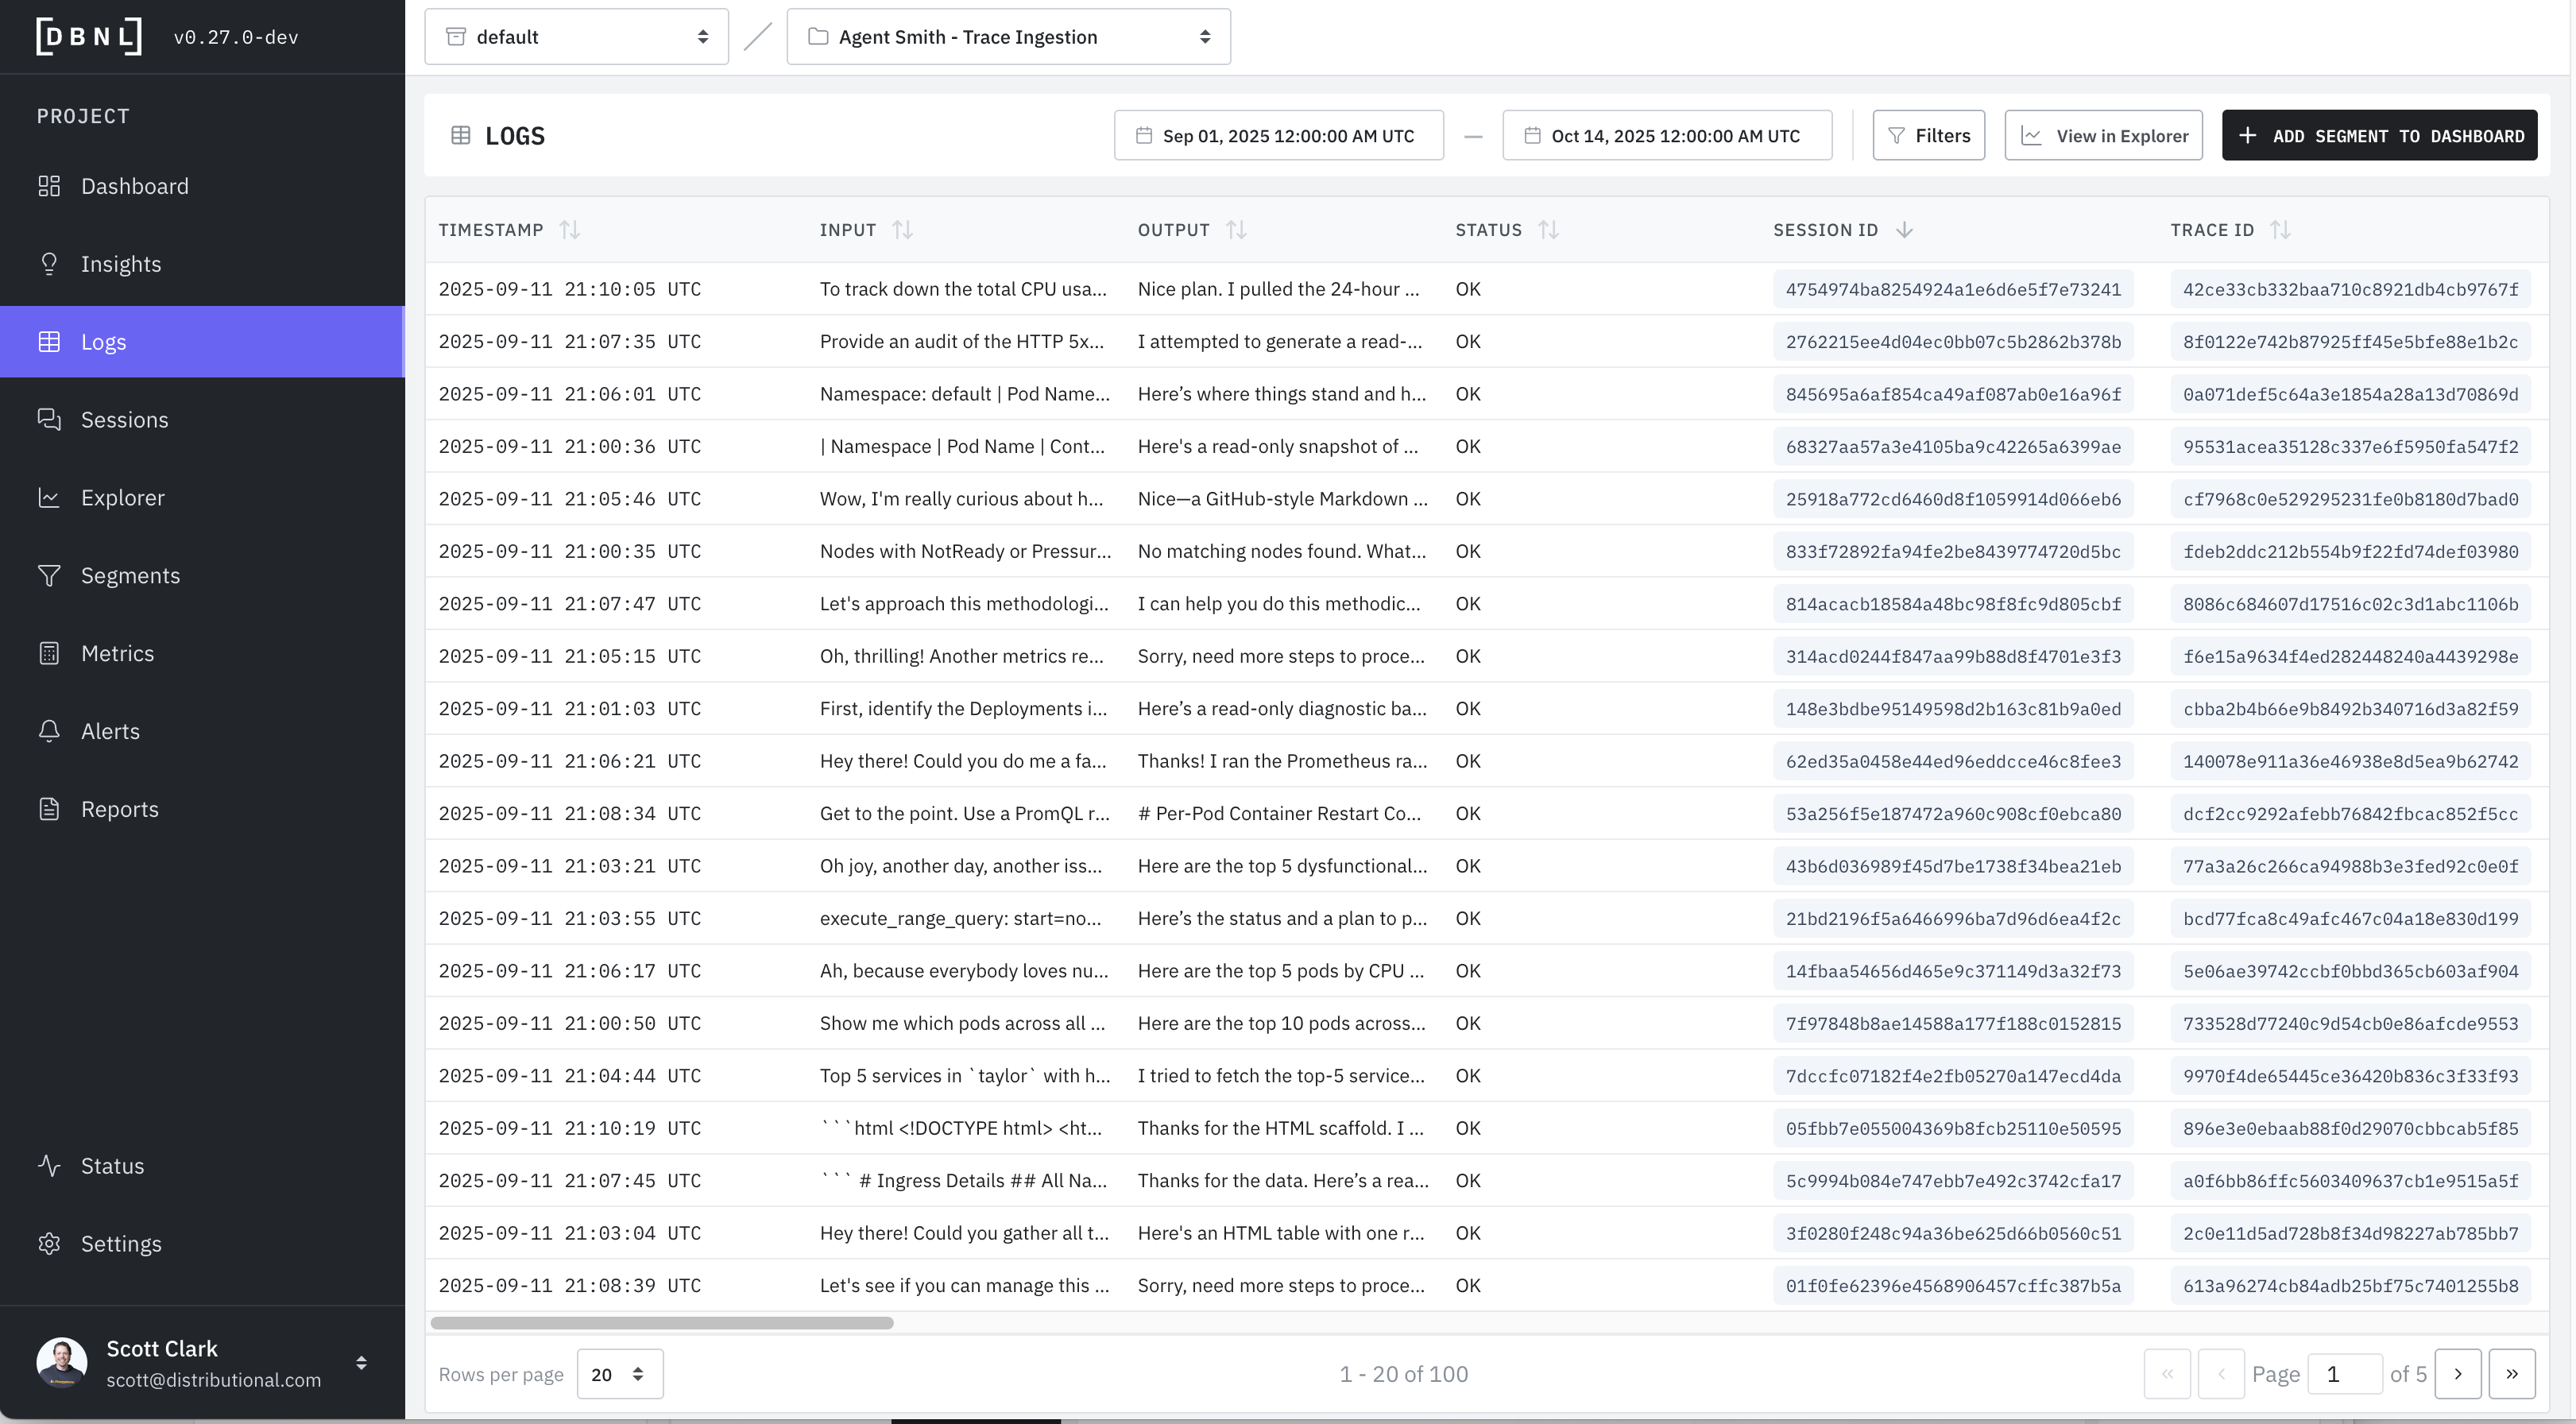
Filterable subsets of all ingested data and all generated Metrics
The Logs page allows the user to inspect specific logs with certain properties defined by
* A specific time window (default: last 7 full days of data)
* Specific filters on [Columns](/v0.29.x/configuration/data-pipeline.md#columns) or [Metrics](/v0.29.x/workflow/metrics.md) (default: no filters)
{% hint style="info" %}
Typically, the Logs page is visited as part of investigating a specific [Insight](/v0.29.x/workflow/insights.md) or by clicking on part of a chart from a [Dashboard](/v0.29.x/workflow/dashboards.md), in which case the filters and time window will already be applied.
{% endhint %}
Individual Logs can be viewed in a variety of ways:
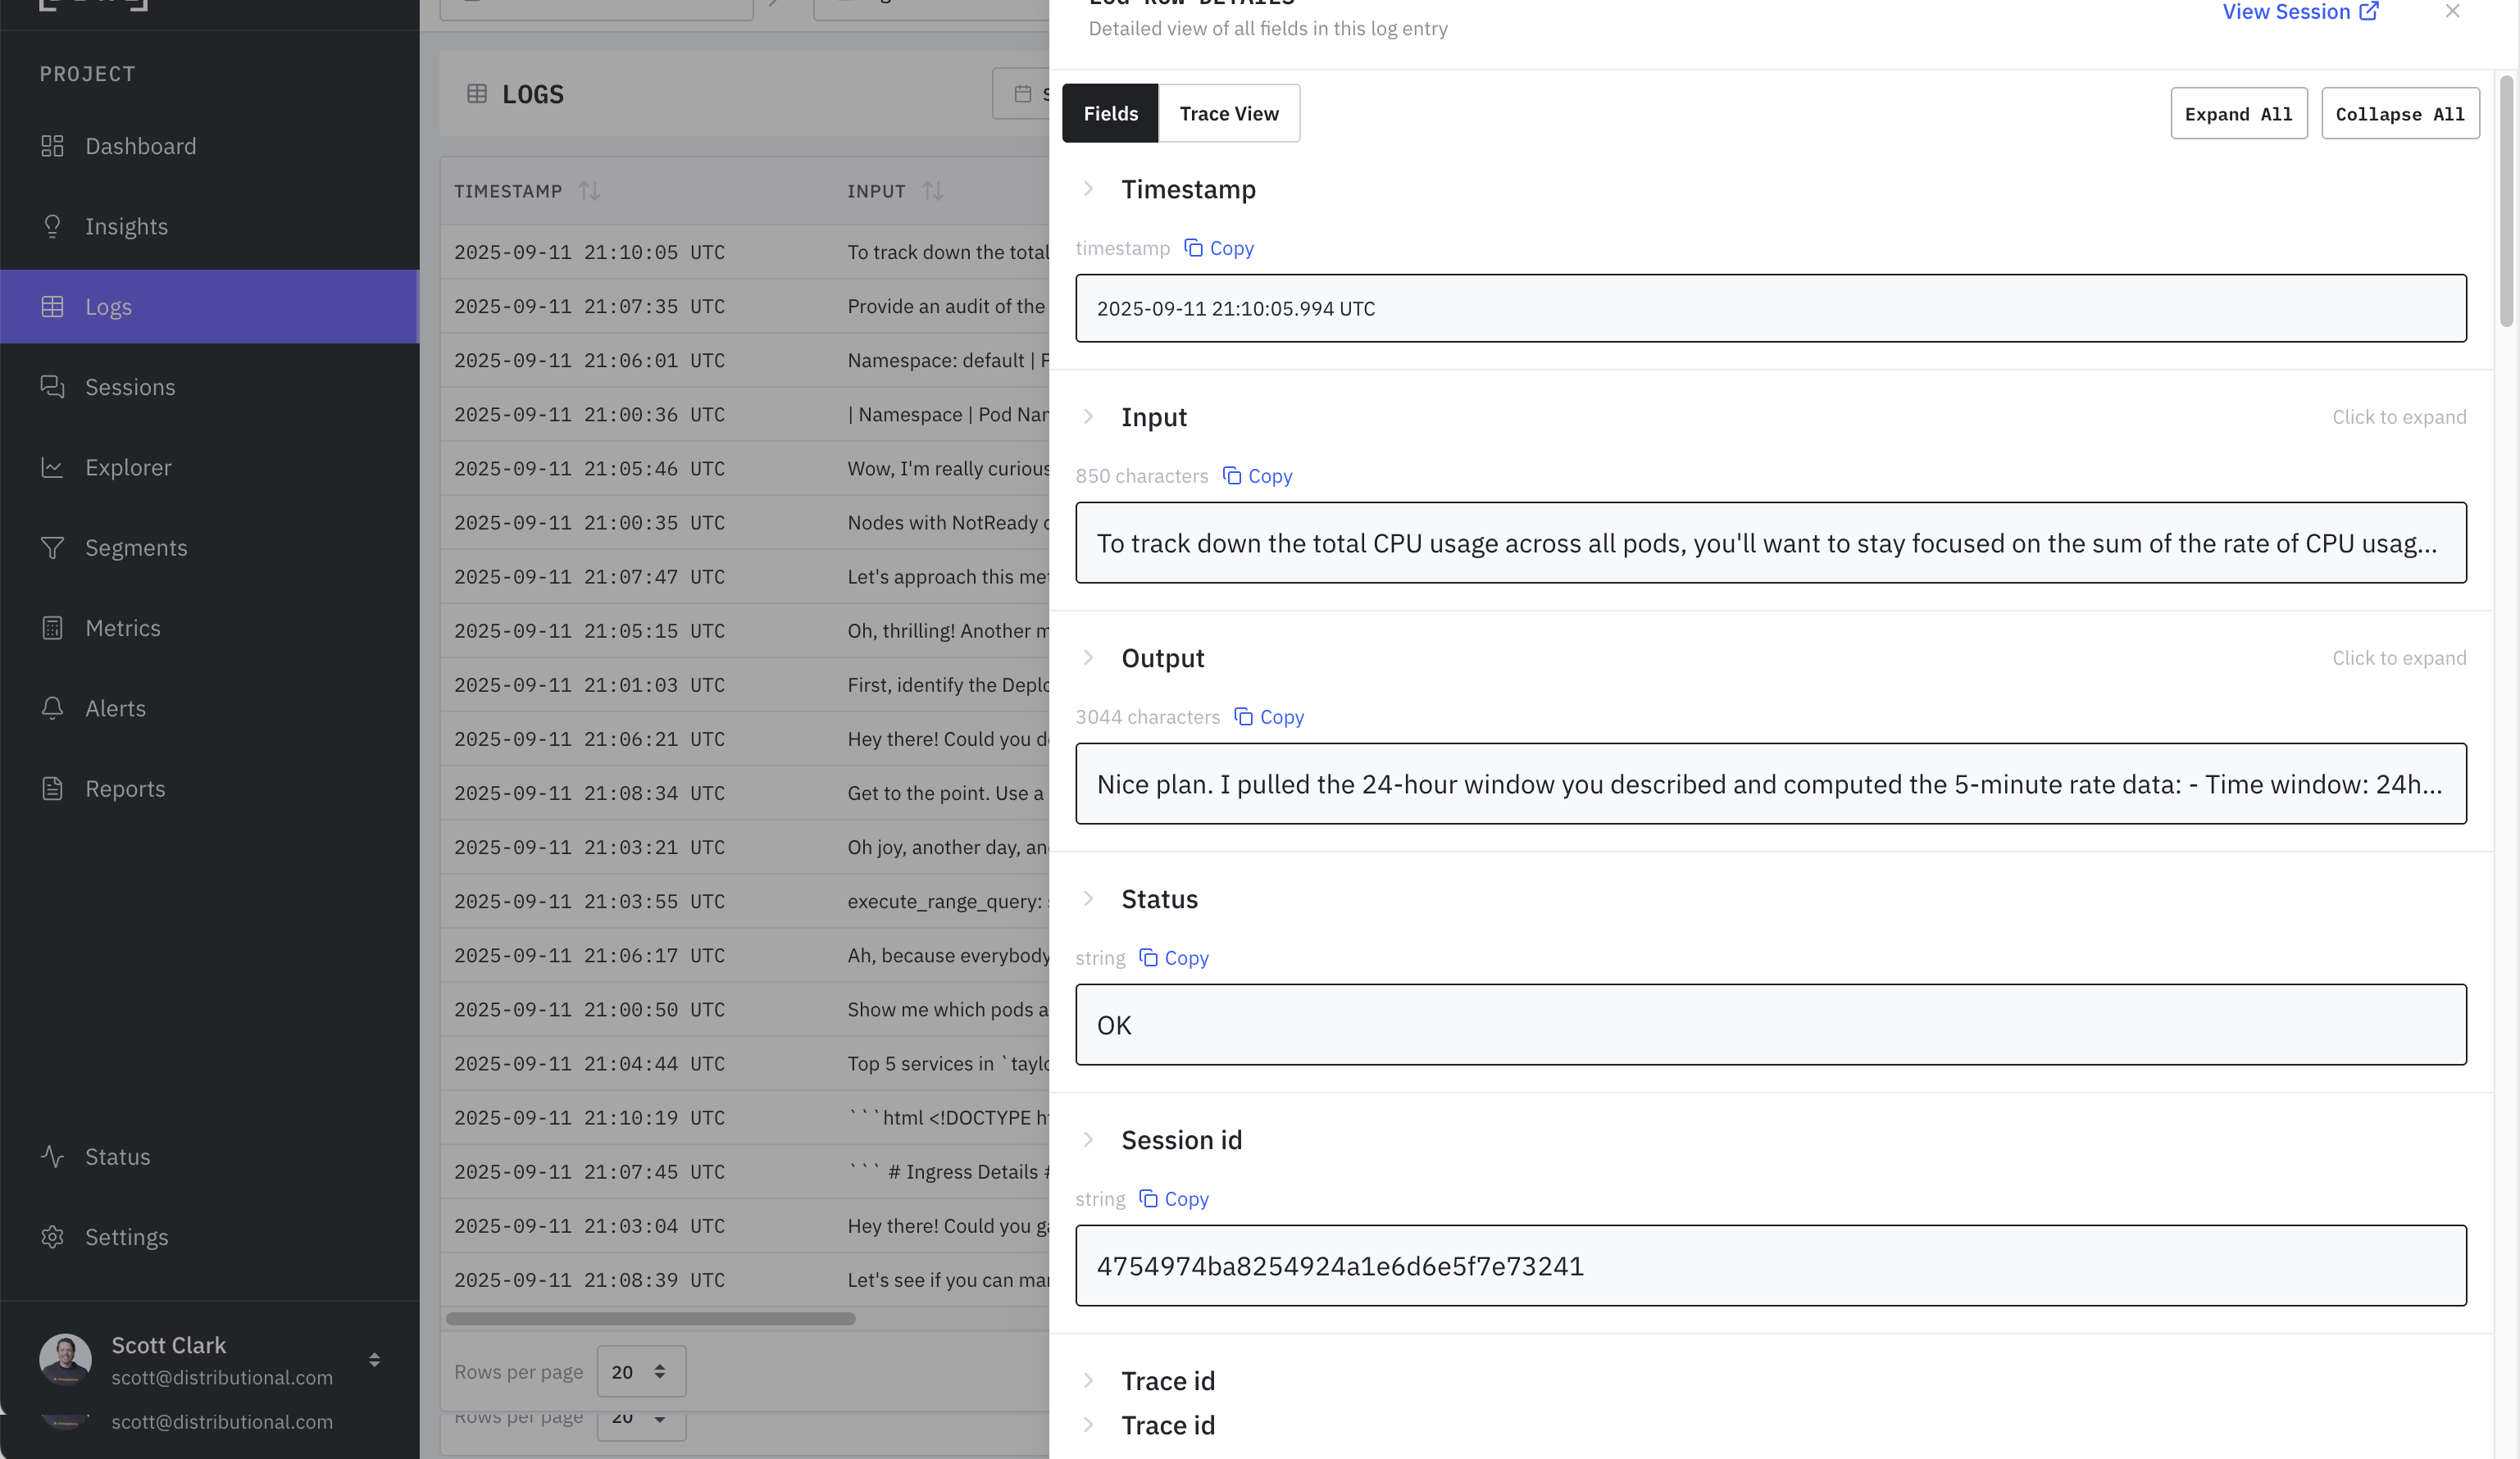
* [**Detailed View**](#log-detail-view): All [Columns](/v0.29.x/configuration/data-pipeline.md#columns) and [Metrics](/v0.29.x/workflow/metrics.md) of the log viewed together and optionally expanded.
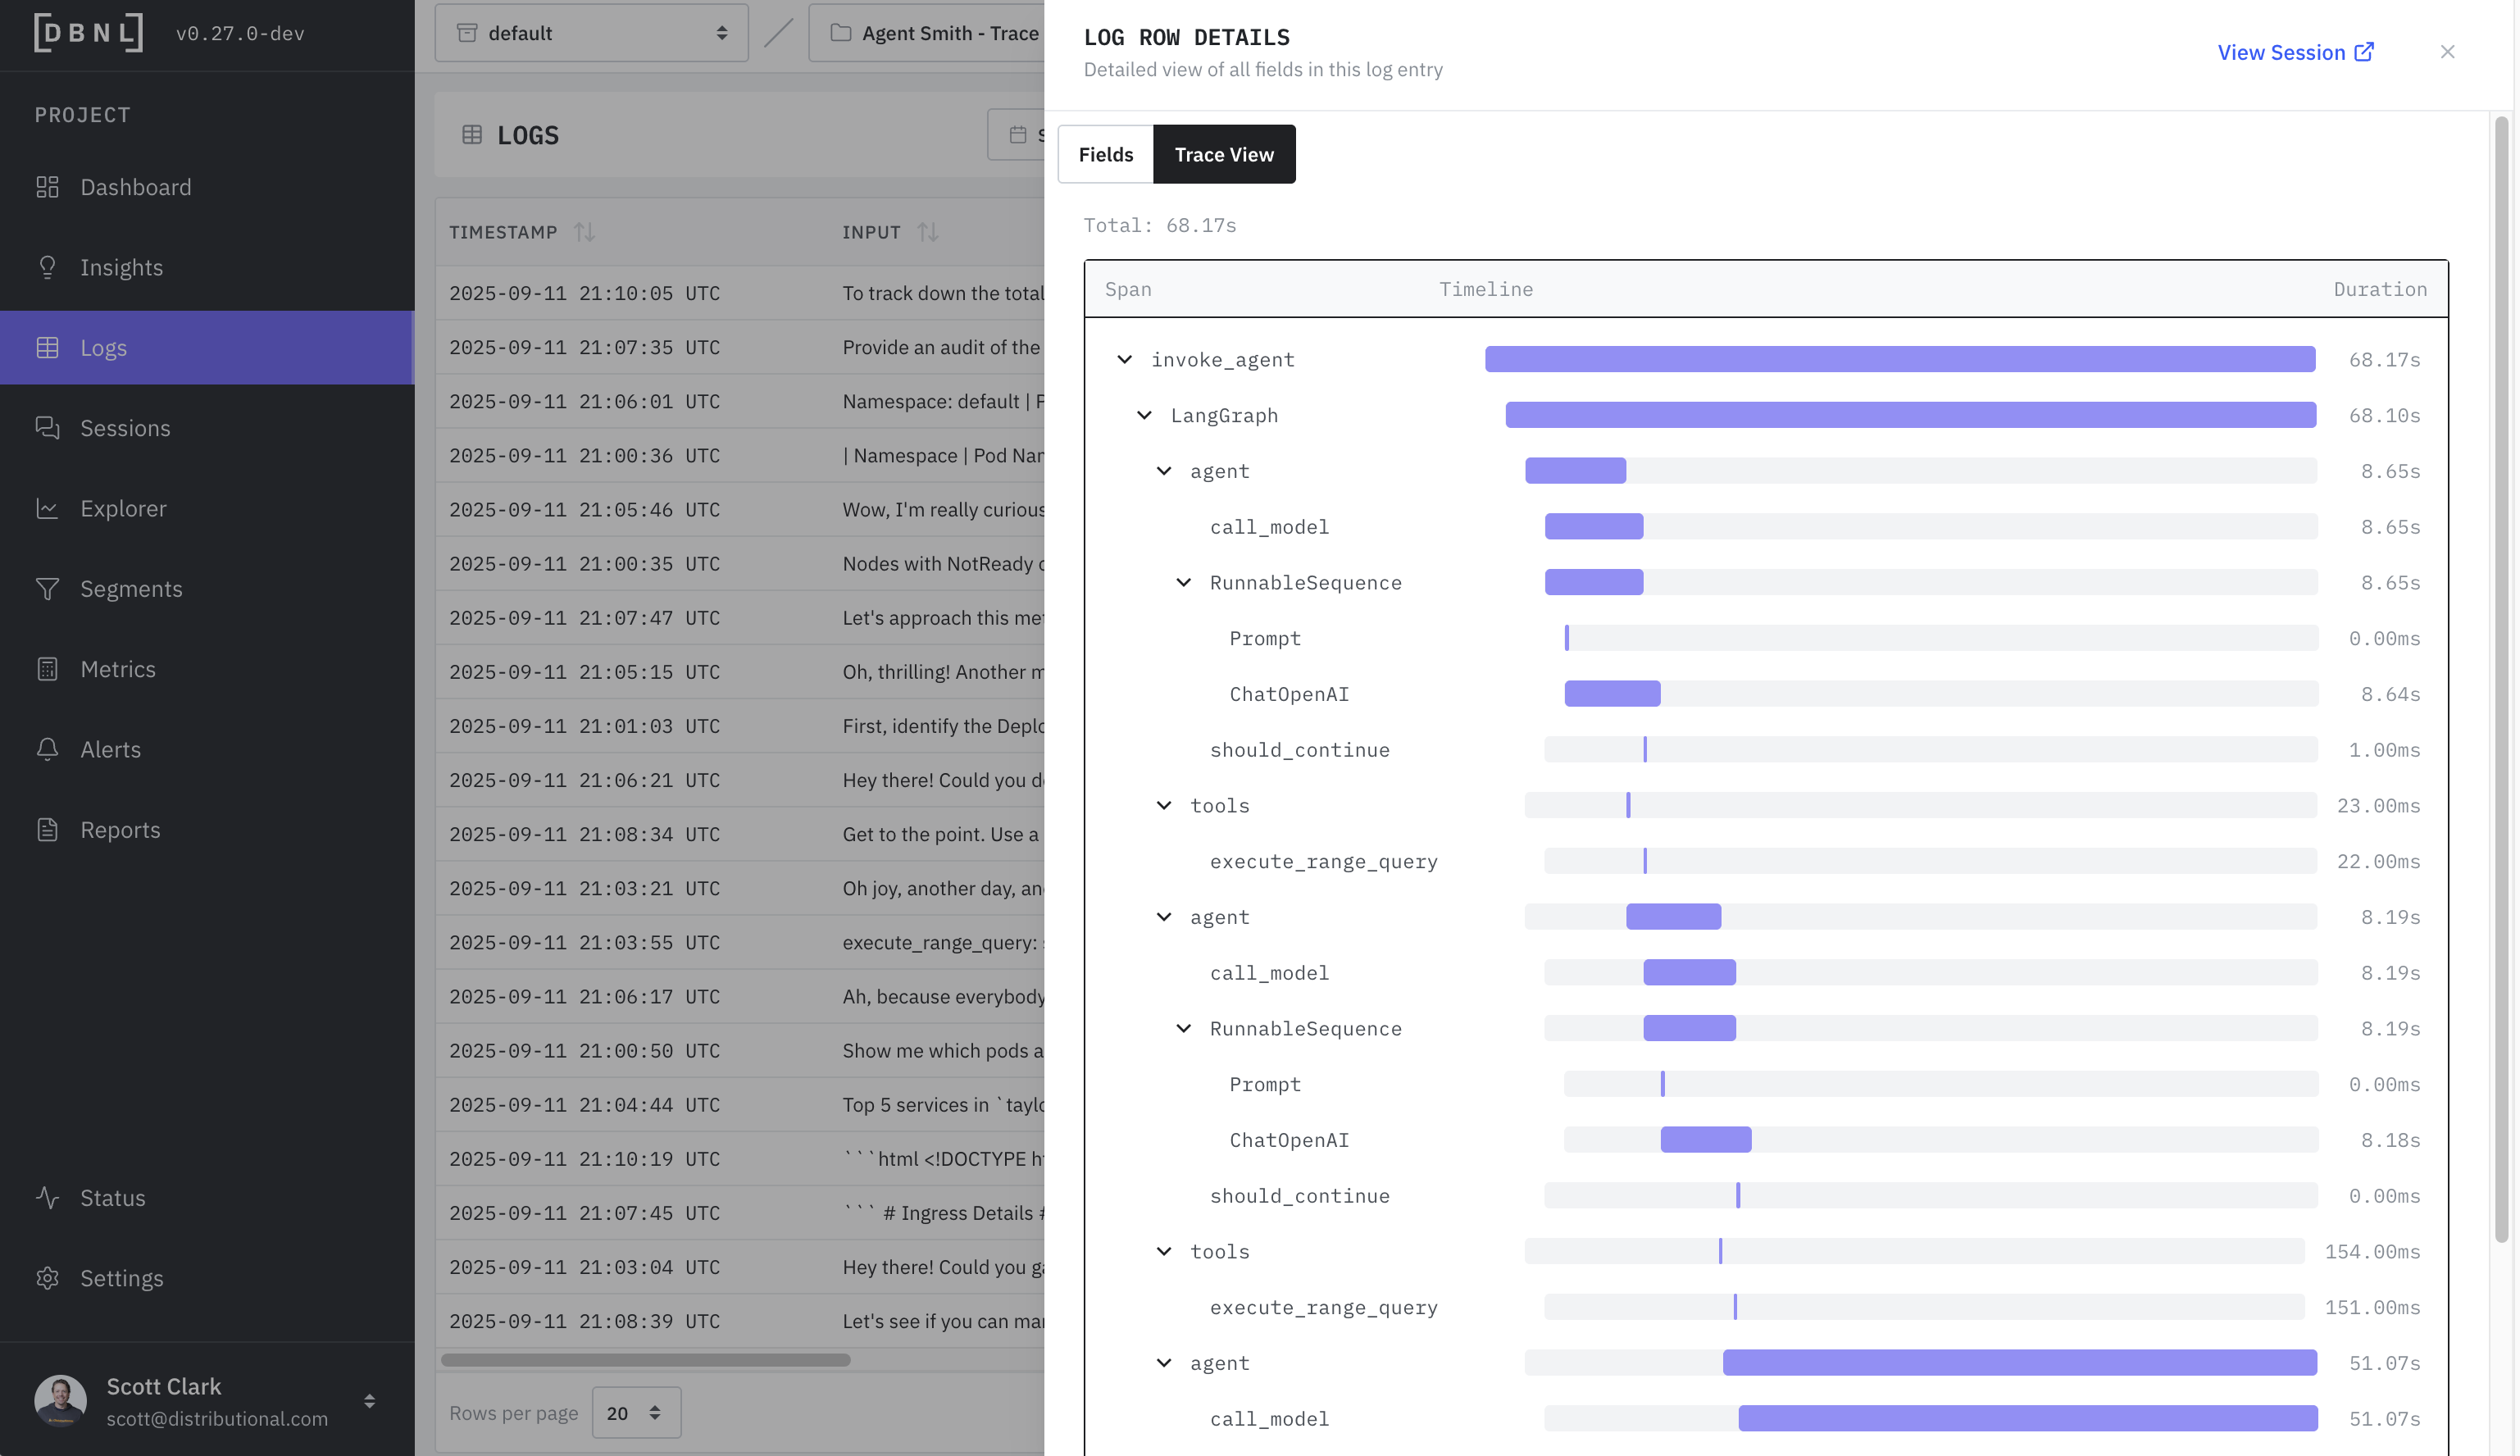
* [**Trace View**](#log-trace-view) (if `spans` provided): The waterfall trace view of latency and timing for each individual span.
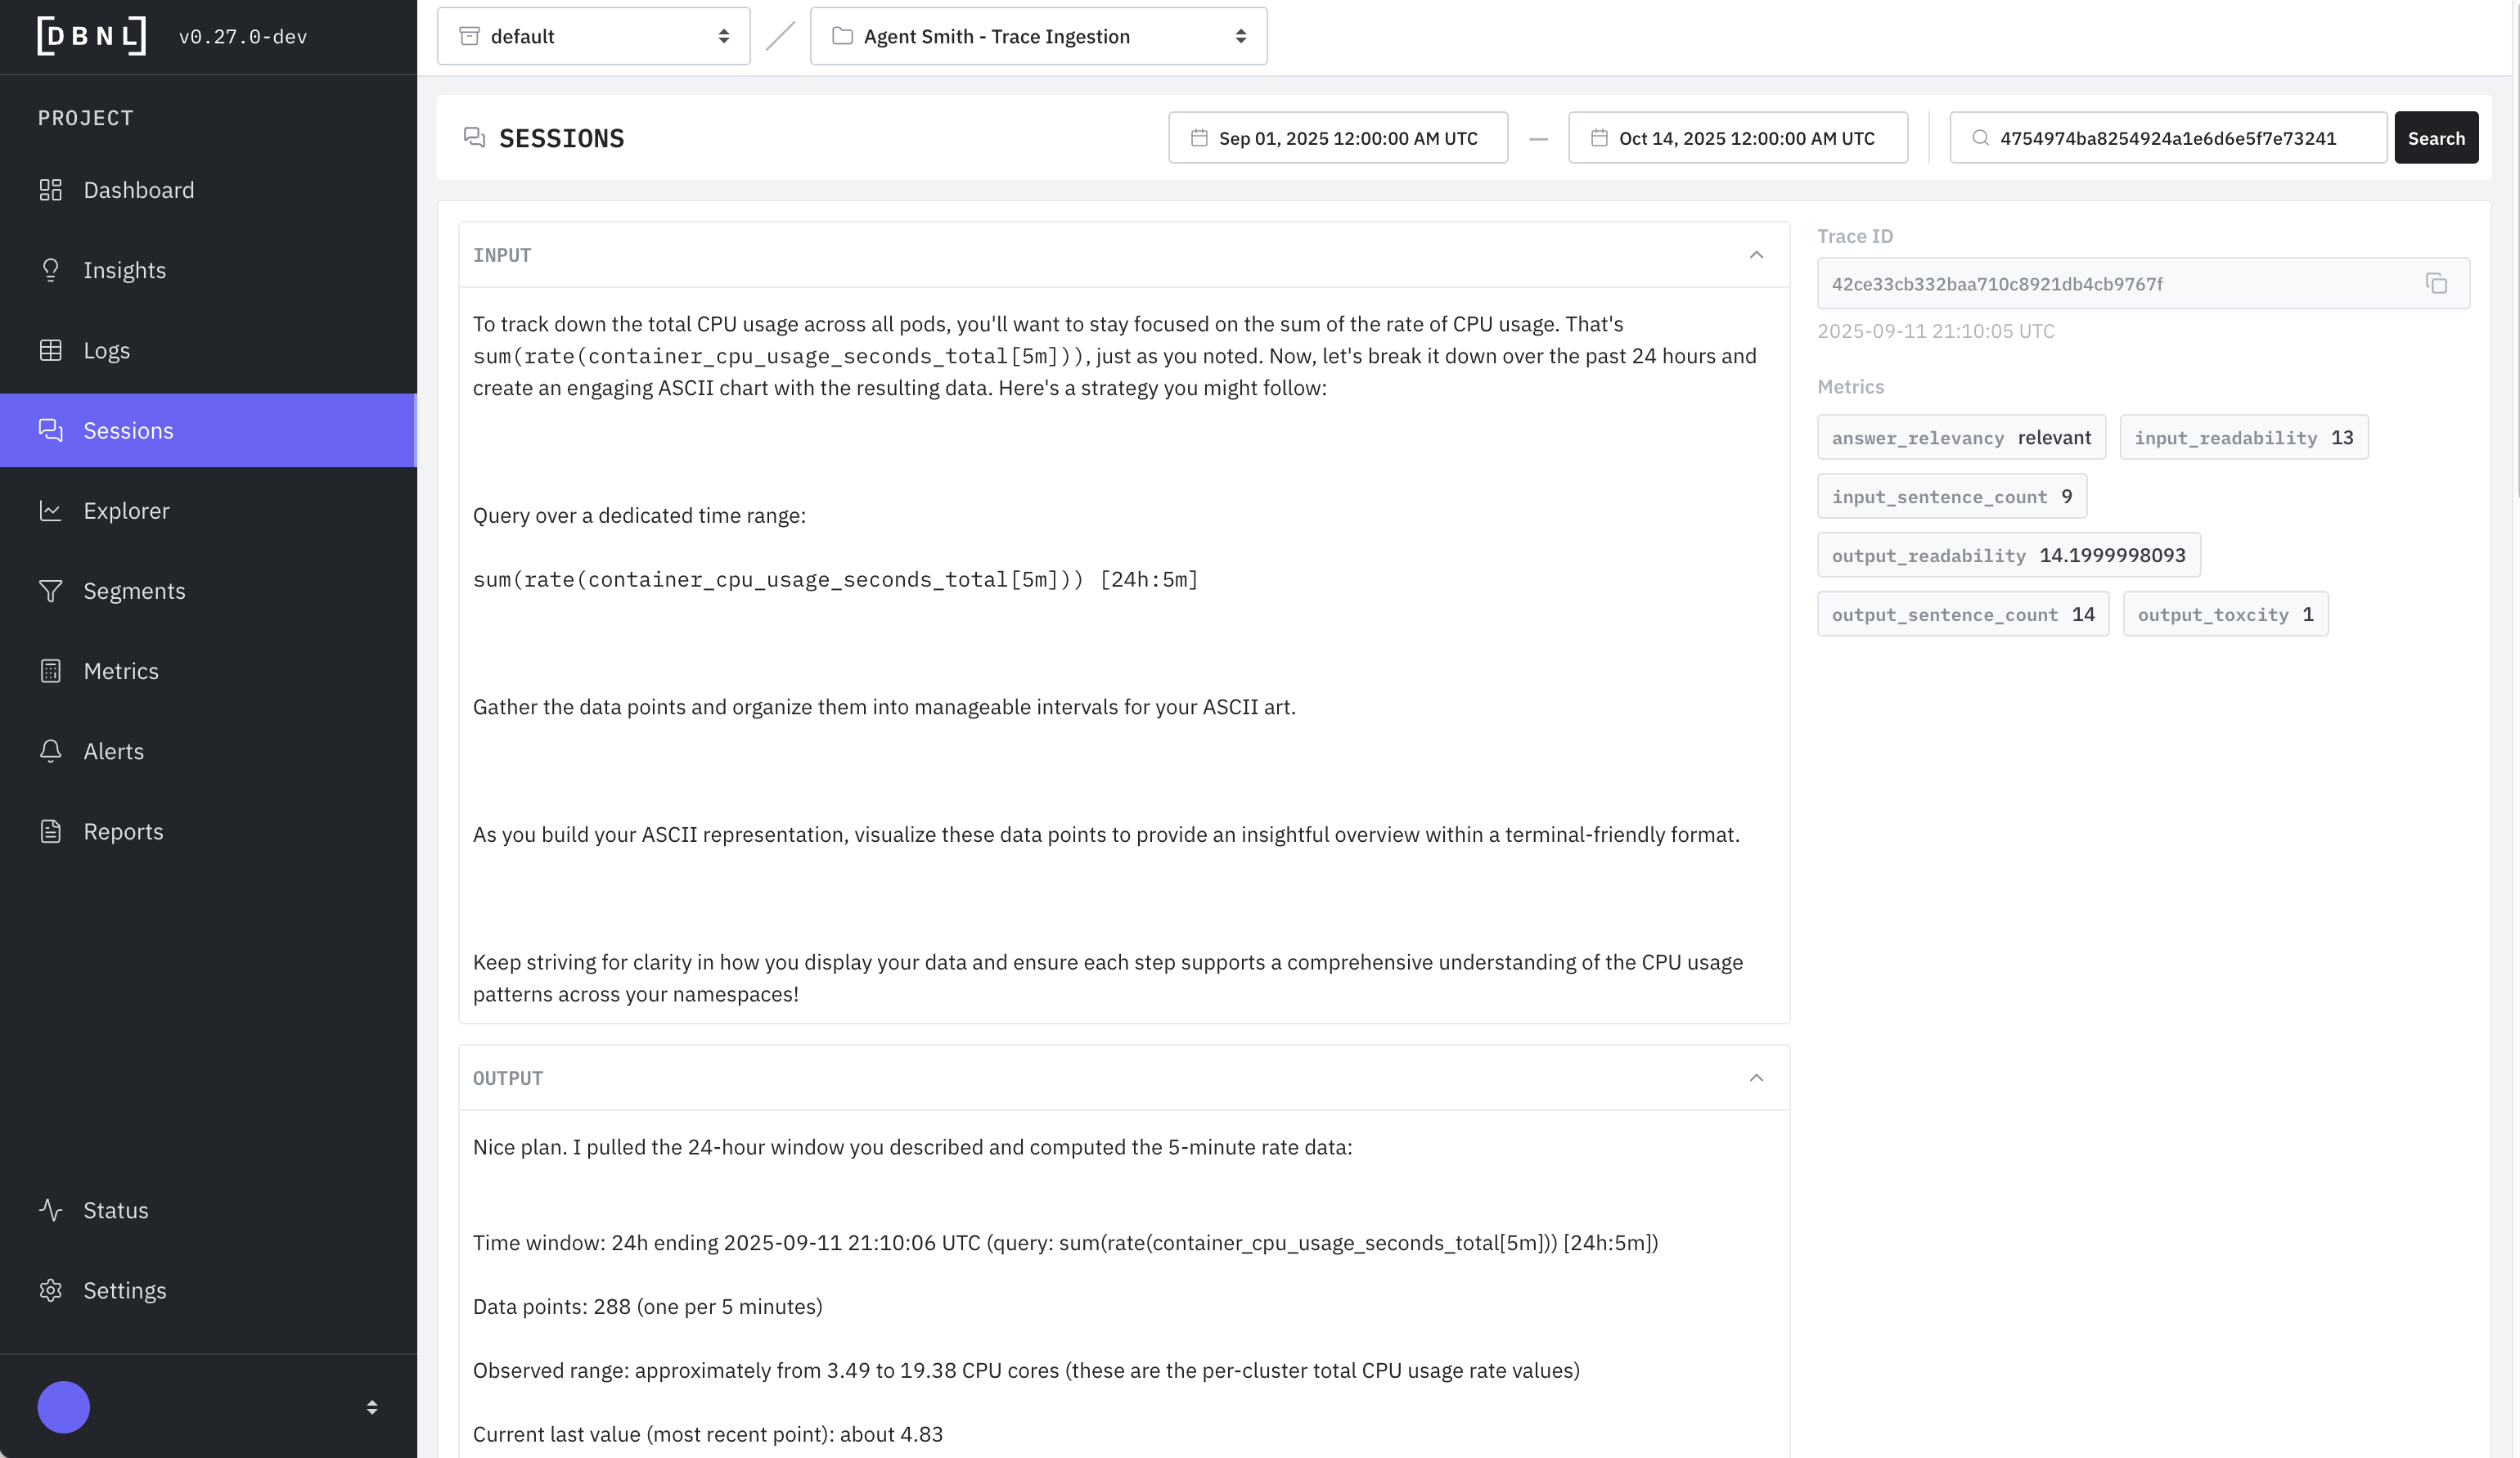
* [**Session View**](#log-session-view) (if `session_id` provided): All associated logs for the given session, along with [Metrics](/v0.29.x/workflow/metrics.md).
As part of inspecting the logs the user can
* View the filtered logs as charts and tables in the [Explorer](/v0.29.x/workflow/explorer.md)
* Save the specific filters as a [Segment](/v0.29.x/workflow/segments.md) to publish it on the [Segments Dashboard](/v0.29.x/workflow/dashboards.md#segments-dashboard)
### Log Detail View
All [Columns](/v0.29.x/configuration/data-pipeline.md#columns) and [Metrics](/v0.29.x/workflow/metrics.md) of the log viewed together and optionally expanded.
### Log Trace View
The waterfall trace view of latency and timing for each individual span. Only available if `spans` was provided as part of the [DBNL Semantic Convention](/v0.29.x/configuration/dbnl-semantic-convention.md).
### Log Session View
All associated logs for the given session, along with [Metrics](/v0.29.x/workflow/metrics.md). Only available if `session_id` was provided as part of the [DBNL Semantic Convention](/v0.29.x/configuration/dbnl-semantic-convention.md).